
What this tool helps you investigate
Begin with the question rather than opening every dashboard. Ask whether the market move is broad, which stocks supplied the index points, which sectors are leading, or what institutions reported. These questions need different data.
Use a consistent date and observation window. A historical end-of-day institutional report should not be described as live confirmation of a five-minute index move.
Choose a market workflow
| Your question | Guide | What it measures |
|---|---|---|
| Which indices and sectors are up or down? | Index heatmap | Index percentage returns and overview breadth |
| Which stocks moved an index? | Index pullers and draggers | Stock contributions in index points |
| Are constituents agreeing? | Index constituent charts | Stock price structure across four timeframes |
| Which sectors lead and how widely? | Sector performance | Returns, breadth, medians and dispersion |
| Is leadership persisting? | Sector rotation | Relative leadership and flow proxies |
| Which groups outperform a benchmark? | Market strength map | Normalised strength and momentum change |
| What did institutions report? | FII DII cash flows | Daily reported buying and selling |
| Where is options activity concentrated? | Options OI dashboard | Active strike, OI and volume screening across the selected market |
| Who holds derivatives positions? | Participant open interest | Long, short and net contracts by category |
| Where is foreign capital allocated? | FPI sector data | Fortnightly holdings and net investment |
| How are related assets behaving? | ETF heatmap and commodity heatmap | Covered asset returns across horizons |
| What is volatility doing? | India VIX | Option-implied uncertainty rather than direction |
| What happened before the open? | Pre-open analysis and GIFT Nifty | Different auction and offshore futures observations |
Read the workspace
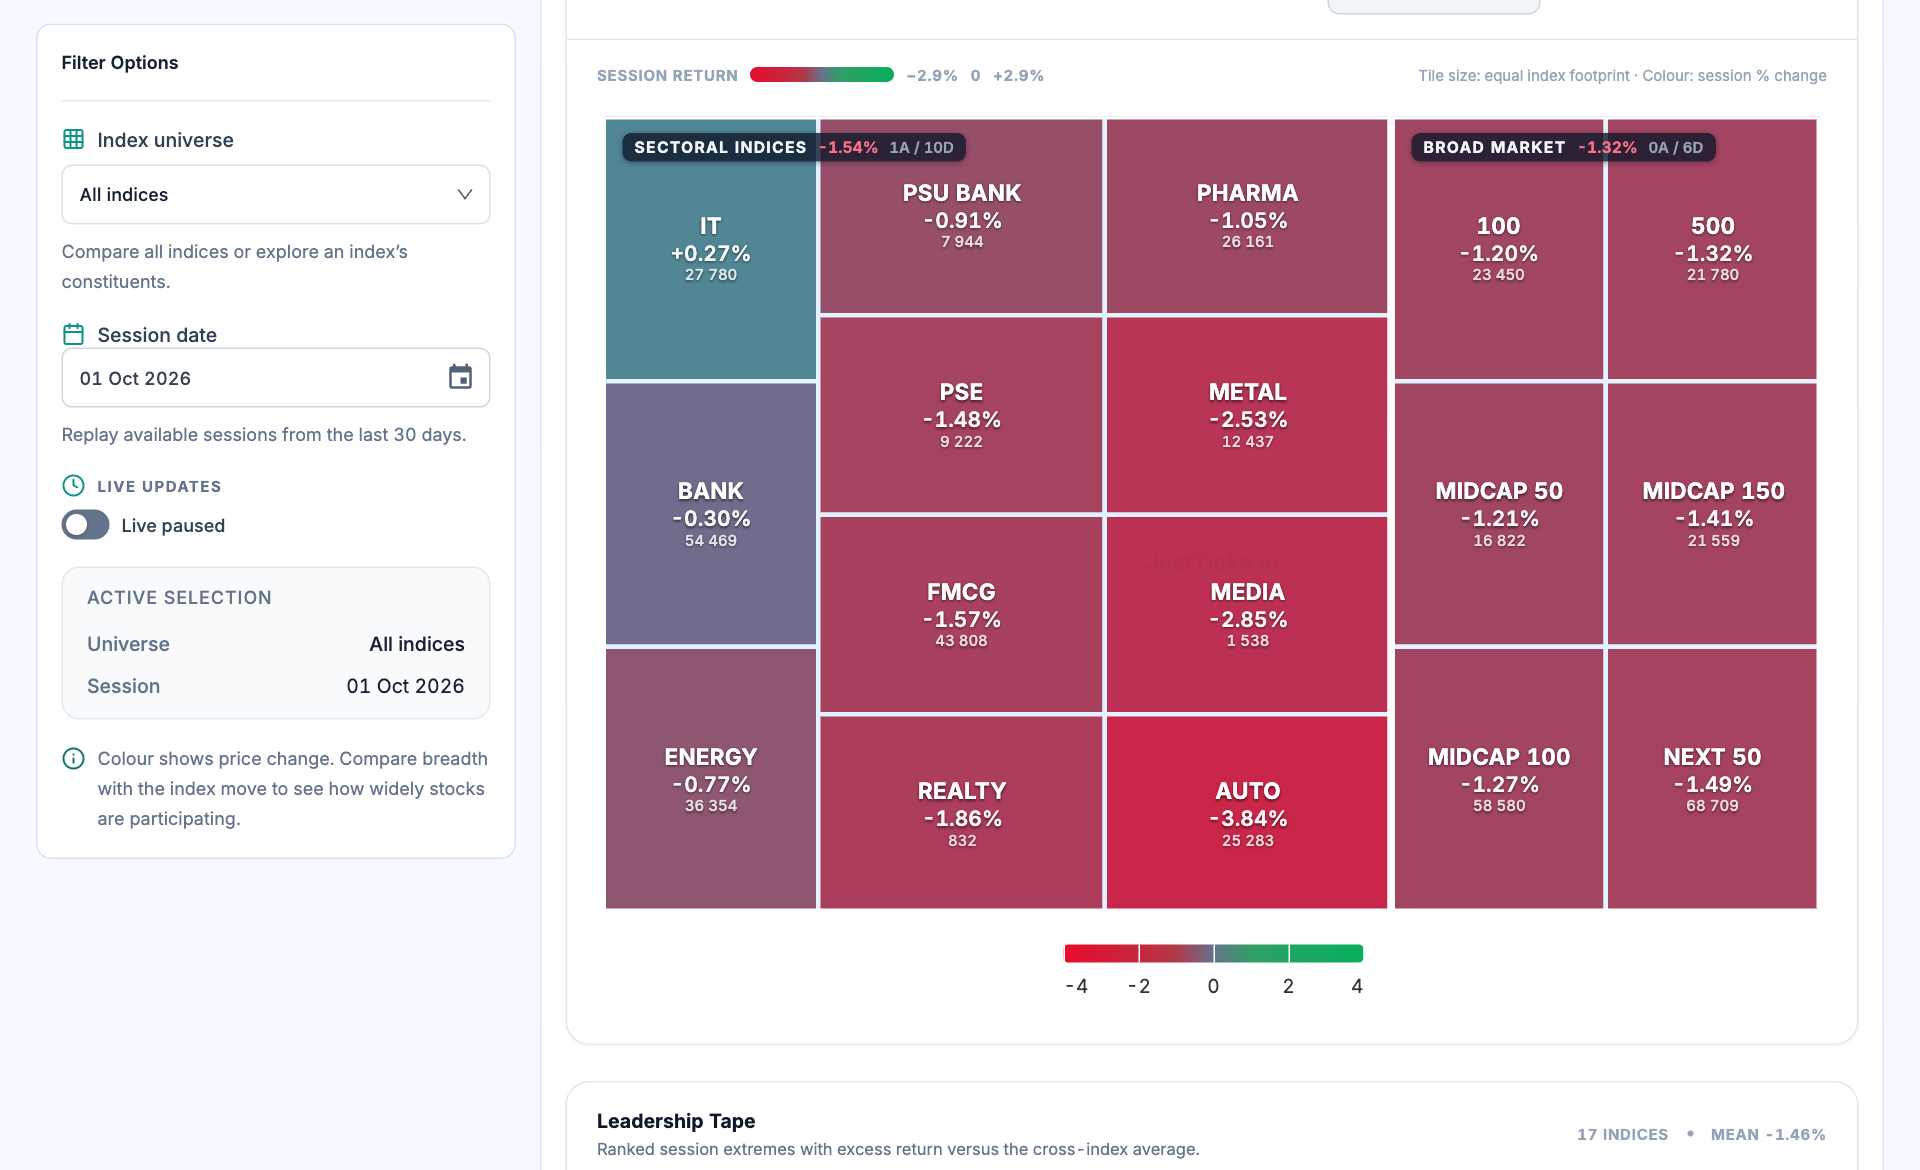
- Index universe. Choose all indices or an individual index before comparing the tiles.
- Session date. The selected session controls the historical snapshot. Confirm it before treating the map as current.
- Return tiles. Tile labels show the index level and session percentage change. This view uses an equal index footprint.
- Colour legend. Use the legend to judge magnitude. Colour indicates return, not turnover or money flow.
A practical market review sequence
- Check the date, source timestamp and index universe.
- Read broad-market returns and stock participation before selecting a sector.
- Use contributions and constituent charts to test whether a few large names explain the move.
- Compare sector leadership over the intended window.
- Add institutional reports or cross-asset context while keeping their publication lag separate.
Keep the measurements separate
| Measurement | It does not establish |
|---|---|
| Index return | How every constituent performed |
| Breadth | The index point contribution of each stock |
| Flow proxy | The identity of a buyer or seller |
| Reported cash flow | The participant derivatives hedge |
| Volatility level | The direction of the next price move |
Connect the views without mixing them
Suppose Nifty rises while most constituents decline. The contributor view shows two large positive contributors, and the sector table reports weak breadth. The evidence supports a concentrated index rise. A separate positive FII cash report may add context, but it cannot prove who drove the exact intraday move.
Checks before drawing a conclusion
- Compare dates and return baselines before comparing colours.
- A weighted index can be supported by a few large constituents.
- Sector and broad-market indices overlap, so tile counts are not independent stock counts.