
What sector rotation measures
Rotation is relative: a sector leads because its stocks are outperforming their peers, not simply because prices are rising. The tool therefore scores every stock against its own sector and the mapped market, then rolls the scores up so each sector has one number.
It describes where leadership sits over the chosen window. It does not measure fund allocations and cannot show money moving directly from one sector to another.
The total-volume model
The default lens uses settled daily price and volume data. Each stock gets a score from -100 to +100 built from four factors, then sectors combine their stocks' scores with breadth.
| Factor | Weight | What it measures |
|---|---|---|
| Relative strength | 35% | Return versus its sector and the mapped-market median |
| Flow pressure | 30% | Close-location-weighted traded value divided by gross traded value |
| Participation | 20% | Directional volume versus the stock's own trailing baseline |
| Persistence | 15% | Balance of positive and negative pressure sessions |
Flow pressure uses where each day closed within its range: a close near the high counts the day's traded value as buying pressure, a close near the low as selling pressure. It is a proxy built from daily data, not a record of who bought or sold.
Why breadth matters
A sector score is more reliable when many constituents agree. The sector view reports positive breadth (the share of stocks with a positive score), the breadth edge and the number of strong leaders and laggards. Small sectors are pulled toward the market average so two stocks cannot define a sector.
The delivery model
The second lens uses end-of-day delivery data. Delivered quantity times closing price is the day's delivered value; it counts as inflow on a day price rises and outflow on a day it falls. Net flow, flow balance, delivery volume against its weekly average and the change in delivery percentage feed a score from -100 to +100.
Delivery figures arrive after the close and describe a past session, so this lens is slower and better suited to conviction than to timing.
Limits and common misreads
- Scores are cross-sectional. Sectors are ranked against each other, so a whole market falling still produces leaders and laggards.
- Pairs are inference. A candidate hand-off between two sectors shows opposing scores and similar liquidity; it does not prove capital moved between them.
- Sector mapping is a classification. Stocks outside the mapped universe, including ETFs, are not scored.
- Corporate actions and news are not modelled.
Check price structure, catalysts and liquidity separately. Nothing here is investment advice.
How to use the Sector Rotation
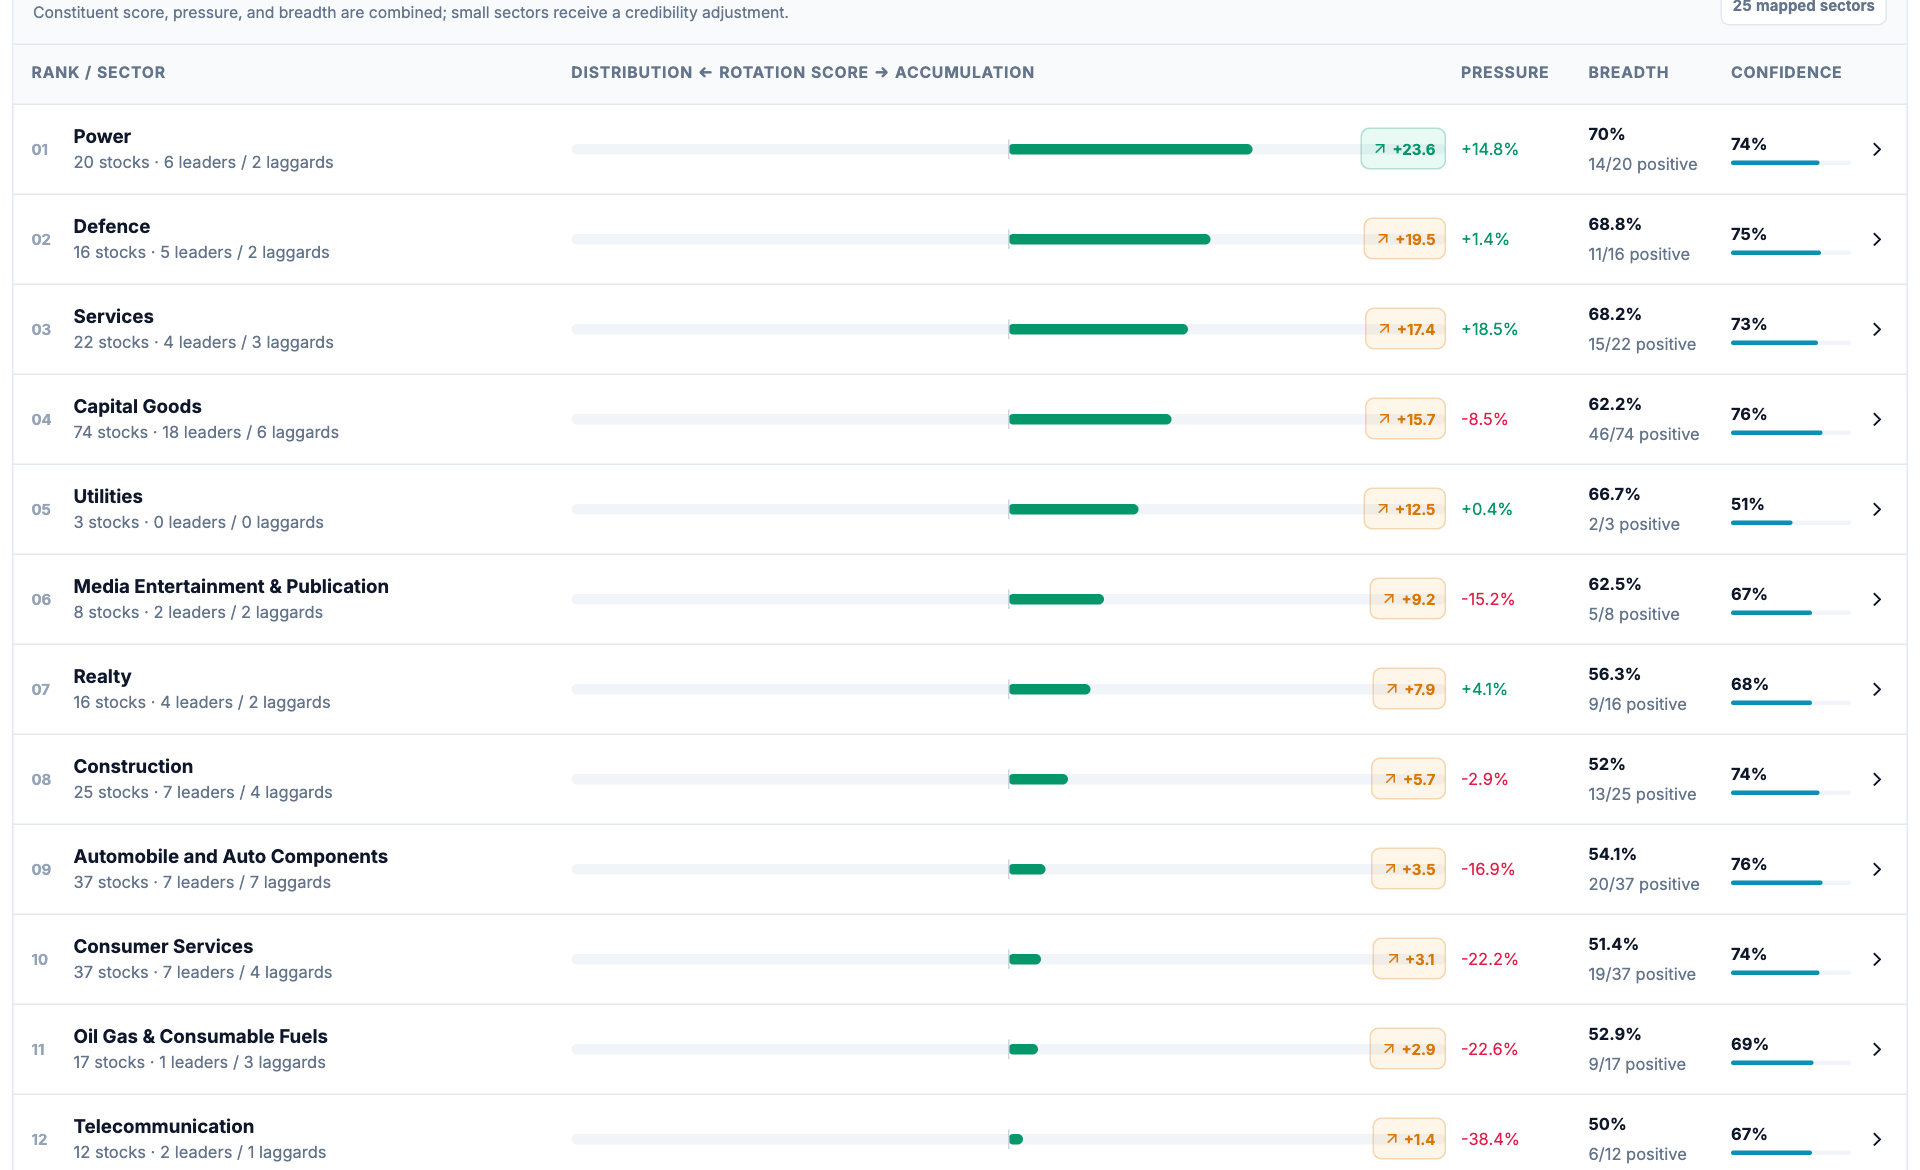
- Sector composition. Read member count and leader/laggard counts before comparing small and large sectors.
- Rotation score. Positive and negative scores summarise the selected model inputs, not measured investor transfers.
- Breadth. The proportion of positive constituents shows how widely the model state is shared.
- Confidence. This is the model consistency measure; it is not the probability of a profitable outcome.
- Choose the total-volume or delivery model and the desired lookback.
- Compare rotation score with pressure and positive breadth.
- Open a sector to review constituent leaders and laggards.
- Compare the same sector across lookbacks to distinguish recent change from sustained leadership.
Read a numerical example
A sector with a positive rotation score can have negative flow pressure if the other model inputs compensate. Read the components rather than assuming every positive score proves fresh buying.
Illustrative arithmetic only; this is not a current signal or a trade recommendation.