
Use the tool: settings, chart and interpretation
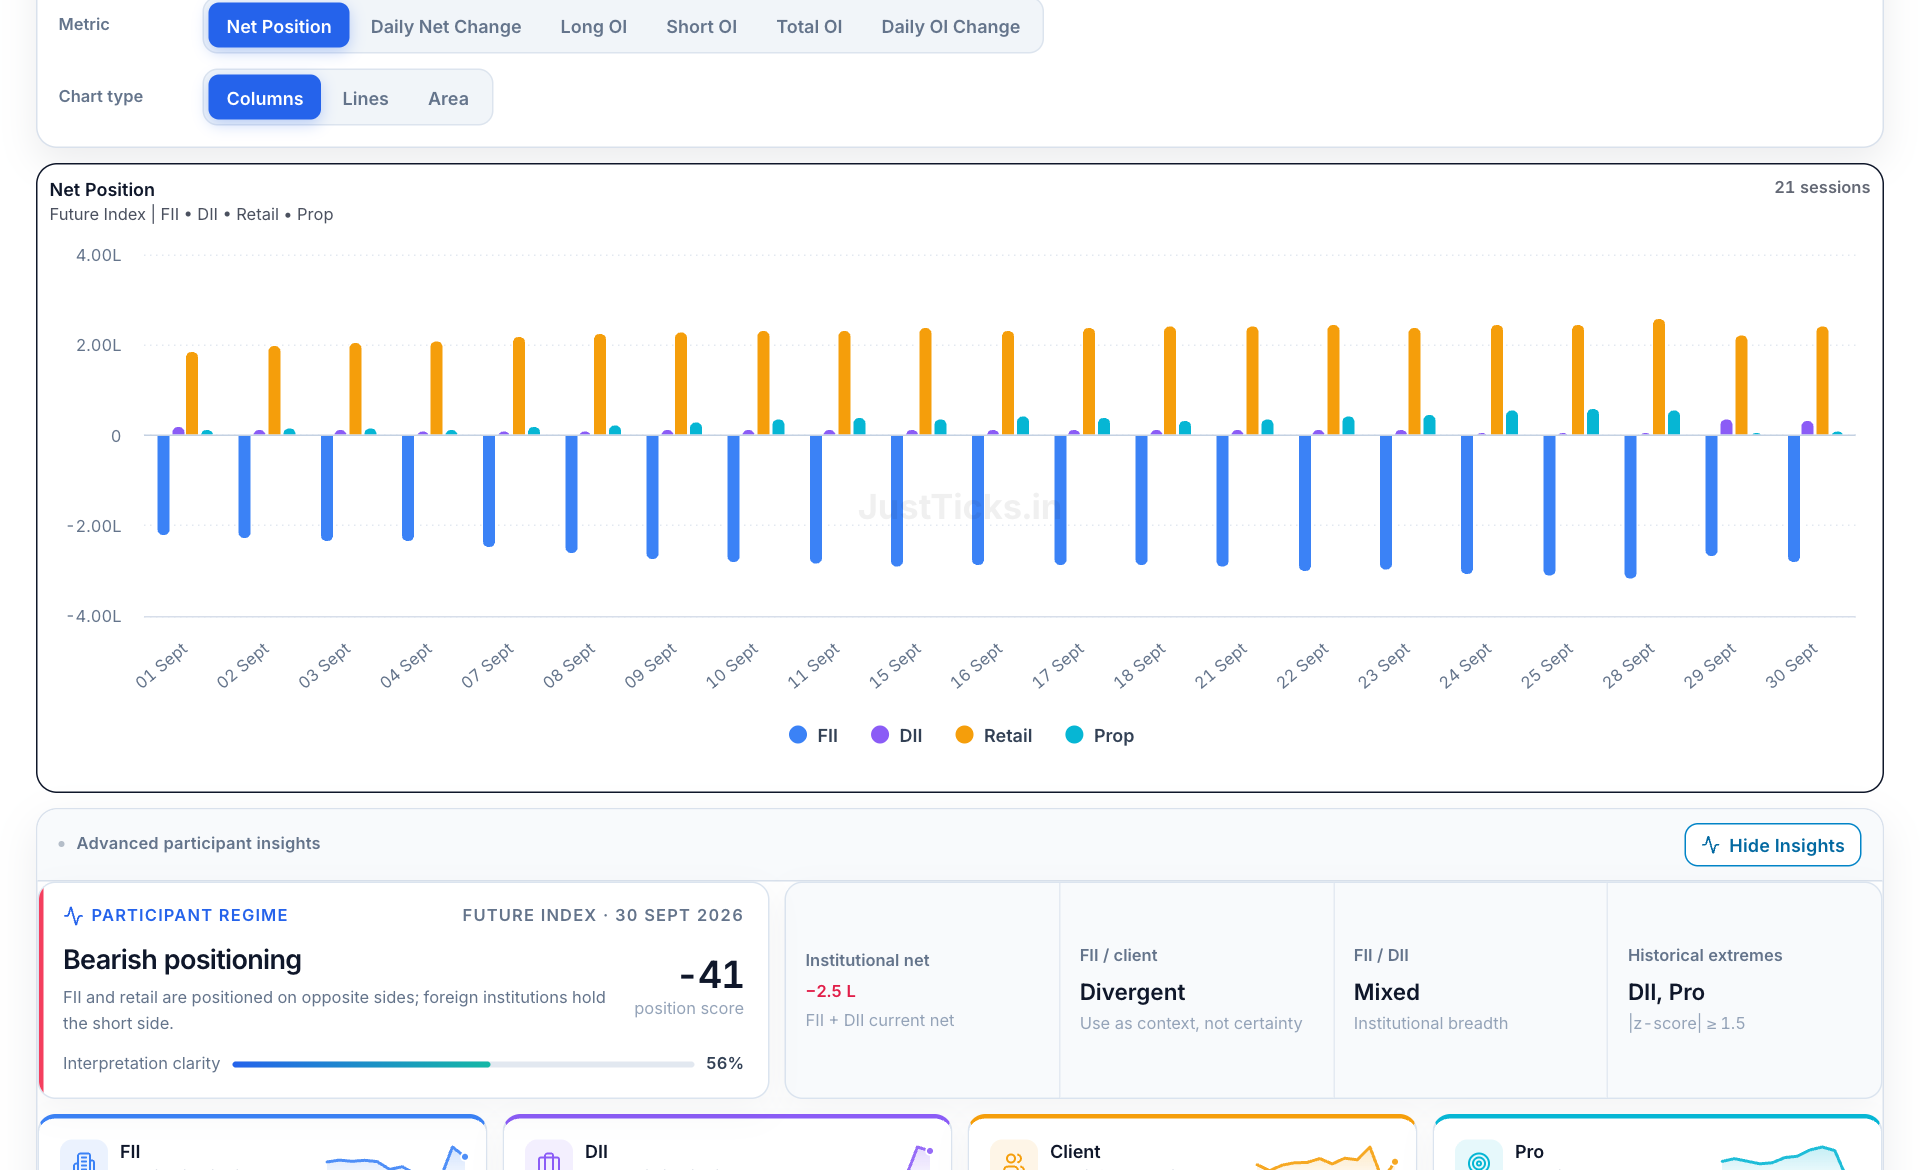
- Metric selector. Net position, daily net change, long OI and short OI answer different questions.
- Instrument class. This historical example shows index futures. Other instrument classes have different exposure meanings.
- Net-position chart. Positive is net long and negative net short for the category, rather than a cash-market flow.
- Interpretation panel. The score and divergence labels summarise the chosen dataset; they do not identify individual participants or predict a return.
- Open Participant Data and choose the instrument class and session window.
- Select long OI, short OI or net position to answer the intended question.
- Compare the categories at matching dates, then switch to daily net change to examine the latest shift.
- Inspect gross longs and shorts before explaining a change in net positioning; the same net change can have different causes.
If one category has 1,20,000 long contracts and 2,00,000 short contracts, its net is -80,000. If the next report has 1,30,000 longs and 2,00,000 shorts, net improves to -70,000 through added longs; it did not become net long.
Open the live tool. The arithmetic above is illustrative and is not a current market reading.
What is participant wise open interest?
Open interest (OI) is the number of outstanding futures or options contracts at the end of a session. The NSE participant-wise OI report breaks that total down by who holds it: for each of the four categories and each instrument class (index futures, stock futures, index options, stock options) it publishes long contracts, short contracts and the resulting net position. Because every long has a matching short, the four categories' net positions sum approximately to zero — one category's buildup is usually another's offset.
Where FII DII data answers “did institutions buy or sell stock in the cash market today?”, participant wise OI answers “which categories are carrying long or short derivatives exposure, and is it building or unwinding?”
The four participants
FII — Foreign Institutional Investors
Foreign capitalGlobal funds, sovereign funds and foreign portfolios registered with SEBI. FII index-futures positioning is the most-watched line in the report — a persistent net-short or net-long stance is read as the institutional directional view on Indian equity risk.
DII — Domestic Institutional Investors
Domestic capitalMutual funds, insurers and pension funds. DIIs use derivatives mostly to hedge cash portfolios or rebalance quickly; their futures positioning is smaller and steadier than FII positioning and often offsets it.
Client — retail and everyone else
Residual categoryEvery account that is not FII, DII or proprietary — retail traders, HNIs, corporates and non-institutional participants. The client category is computed as the residual of total market OI, so it inherits any noise in the other three. FII–client opposition is the classic smart-money-versus-retail divergence read.
Pro — proprietary desks
Broker capitalProprietary trading desks of brokers trading the firm's own capital — often market makers, arbitrage and intraday flow desks. Pro positioning changes fast and is frequently the counterparty side of client and FII flow.
The difference between FII/DII and client/pro, in one line: FII and DII are institutional categories defined by who owns the money (foreign vs domestic pools); client and pro are the non-institutional remainder split by account type — ordinary client accounts versus brokers' own proprietary capital.
How to read the daily report
Start with one number per category: the net position (long minus short contracts) in index futures, then its daily change. A participant can stay deeply net short for months while the daily change tells you they are aggressively covering — direction comes from combining current stance, change, and whether total OI expanded or contracted.
The buildup matrix
| Net position | Open interest | Interpretation |
|---|---|---|
| Net rising | OI rising | Long buildup — new long positions are entering the market. |
| Net falling | OI rising | Short buildup — new short positions are entering the market. |
| Net rising | OI falling | Short covering — existing shorts are buying back; the pressure is exiting. |
| Net falling | OI falling | Long unwinding — existing longs are closing out. |
The matrix is read per participant, then cross-checked against price: short buildup with a rising index signals strong hands absorbing the shorts, while long buildup into a falling index signals trapped longs.
The FII long-short ratio
The FII long-short ratio condenses FII index-futures positioning into one number — the share of long contracts in FII gross futures position:
FII long-short ratio = FII long contracts ÷ (FII long + FII short contracts) × 100
| Reading | FII stance |
|---|---|
| Below 30% | Heavily net short |
| 30–45% | Net short |
| 45–55% | Balanced / hedged |
| 55–70% | Net long |
| Above 70% | Heavily net long |
Extremes mark crowded positioning, not turning points on their own — crowded shorts fuel sharp short-covering rallies, crowded longs make the market vulnerable to unwinding. Read the ratio alongside its own history (the participant data tool charts it per session) and alongside price structure and volatility.
Positioning vs flow: participant OI and FII DII data
The two most-confused NSE institutional reports answer different questions. FII DII cash-market data is a flow measure — value bought and sold in the cash segment on a given day. Participant wise OI is a stock measure — the derivatives positions still open at the end of that day. A foreign fund can sell cash shares and hold index-futures longs as a hedge; only reading both reports shows the full exposure. The FII DII data guide covers the cash side, including how FII derivatives buy/sell/OI figures relate to the cash report.
Limitations and common misreads
- Client is a residual. It inherits every account that is not FII, DII or pro, so “client long” is not equal to “retail is bullish”.
- Hedging is invisible. Options OI can hedge futures OI; category-level nets do not reveal which legs are hedges.
- Extremes extend. Statistically extreme positioning can stay extreme far longer than expected; it marks risk, not a timer.
- End-of-day only. Positioning is a snapshot after close — intraday readings are estimates.