
What this tool helps you investigate
Use this tool to explain an index move through the point contributions of its constituents. Pullers contribute positive points and draggers negative points over the measured window.
A stock percentage return and an index contribution answer different questions. A large-weight stock moving 1% can matter more to the index than a small-weight stock moving 4%.
Read the workspace
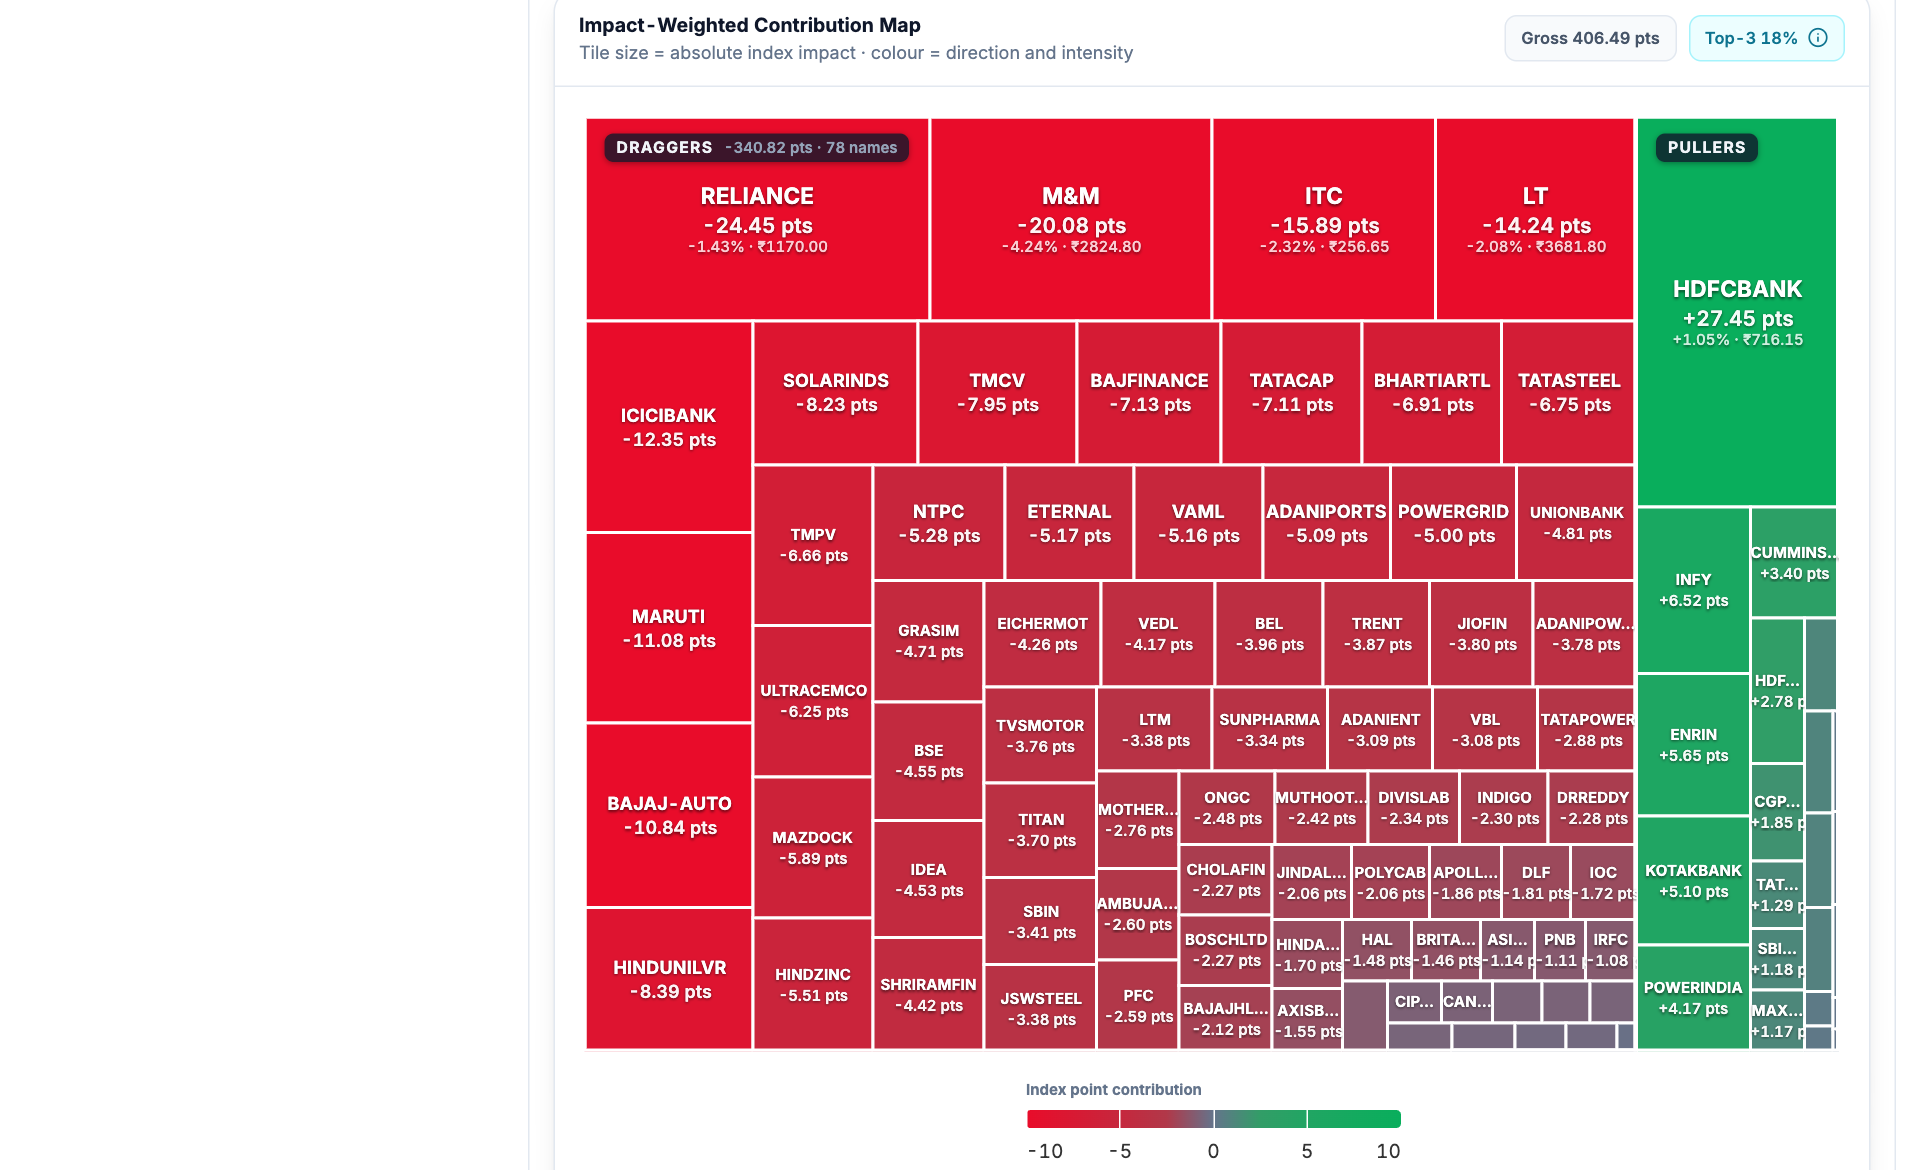
- Map encoding. The heading states that tile area follows absolute index impact; colour shows direction and intensity.
- Negative contributor. A negative point contribution means this constituent pulled the index lower in the measured window.
- Positive contributor. Positive contributors can offset some losses even when most of the map is red.
- Concentration. Read concentration alongside gross impact to distinguish broad participation from dependence on a few names.
How to use Index pullers and draggers
- Select the index and observation window in the tool.
- Read total puller and dragger contributions before concentrating on one stock.
- Use the map to identify the largest absolute contributors on both sides.
- Open constituent charts to check whether the contribution persisted or reversed during the session.
Understand the measurements
| Measurement | How to read it |
|---|---|
| Point contribution | Estimated effect of one constituent on the index in points. |
| Stock return | The stock percentage move; it is not its index contribution. |
| Gross impact | Positive and negative contributions considered in magnitude rather than netting them away. |
| Concentration | How much contribution is concentrated in the leading names. |
A worked example
If positive contributions total 70 points and negative contributions total -110 points, their net is -40 points. The negative index result masks meaningful buying in the pullers; the contribution breakdown makes that offset visible.
Worked example
This example explains the calculation or reading process. It is not a current market observation or a trade recommendation.
Checks before drawing a conclusion
- Use the selected index and matching constituent weights.
- Do not compare contributions across indices as though their point scales were identical.
- Contributions describe a measured move, not the motivation of buyers and sellers.