
Use the tool: settings, chart and interpretation
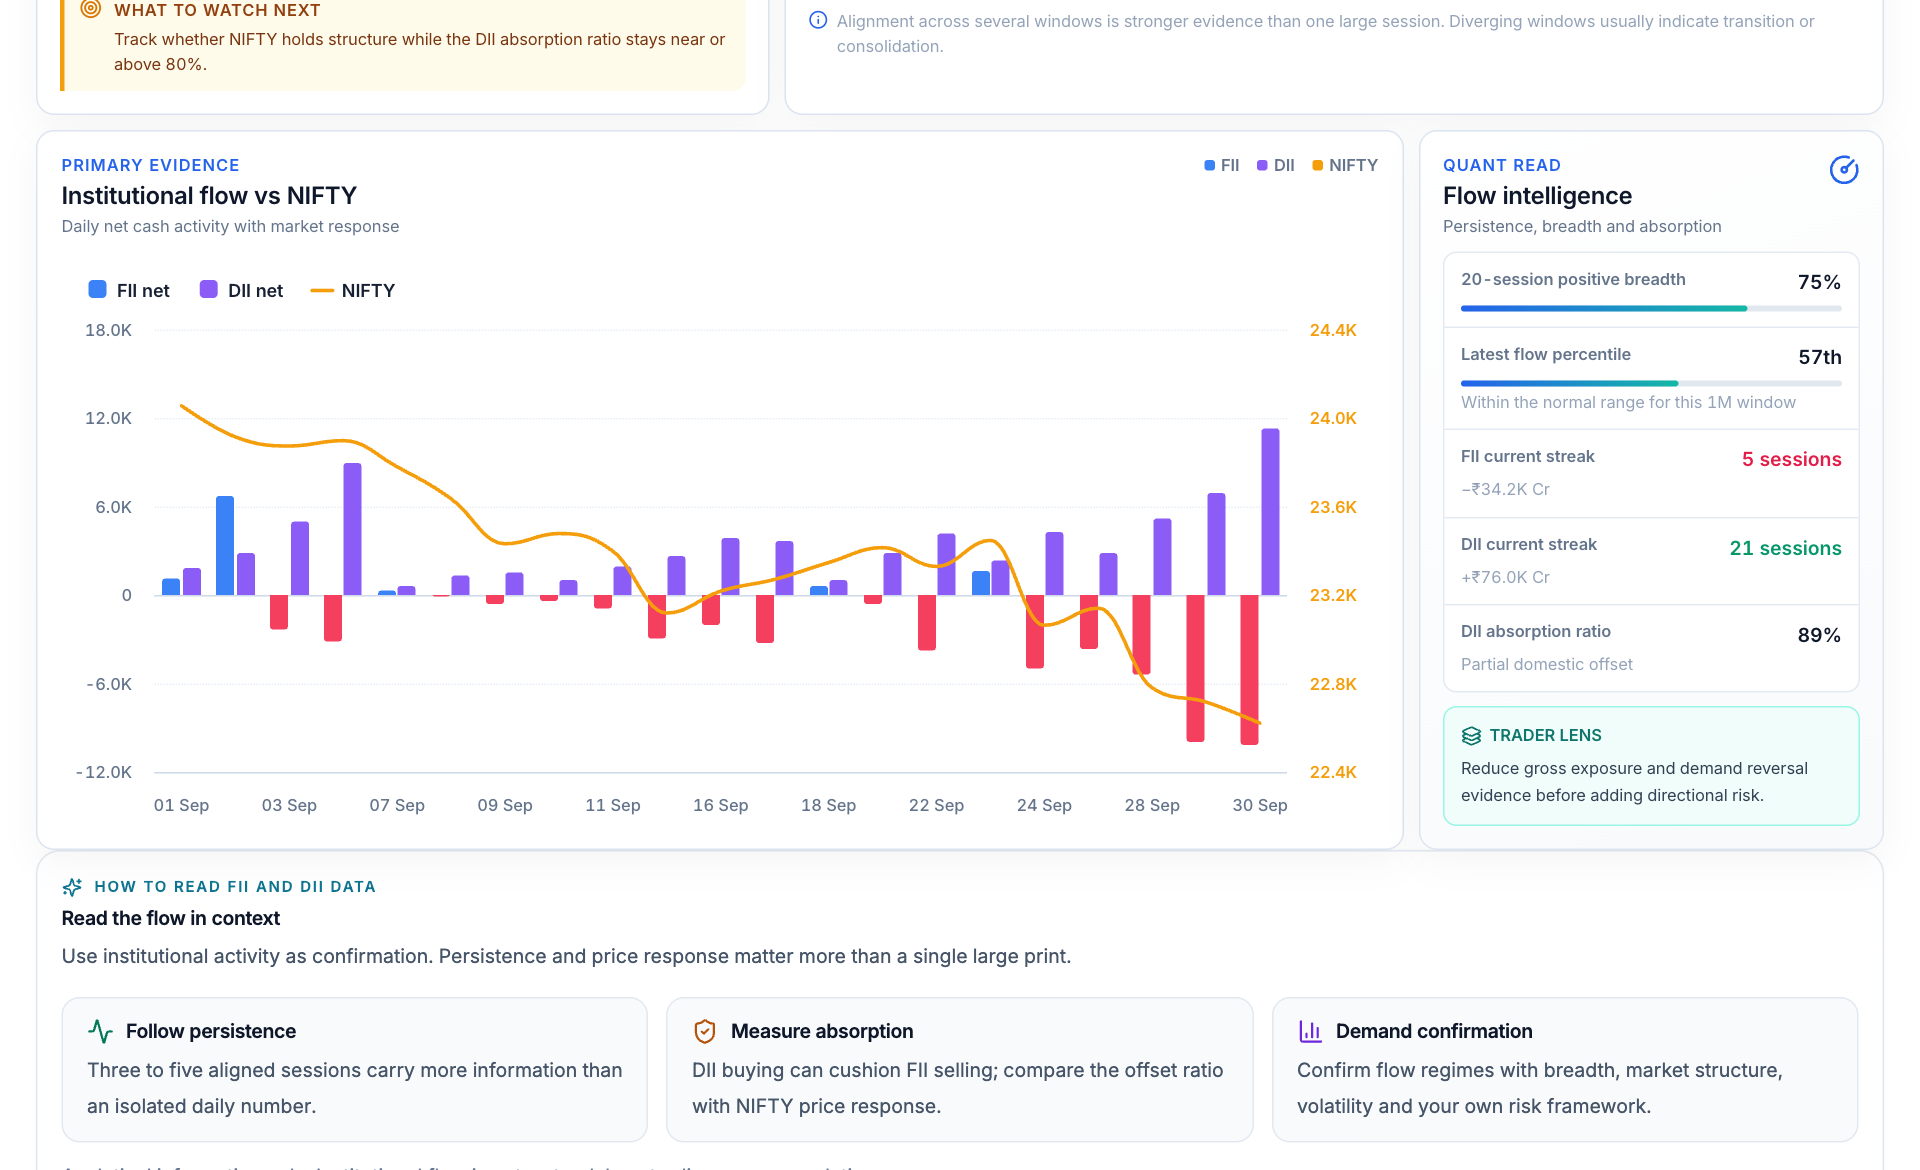
- Cash-flow bars. The bars show daily net cash activity. Read their units separately from the index axis.
- Nifty overlay. The line supplies market-response context. Correlation in this window does not establish causation.
- Persistence and breadth. Streak and breadth summaries cover multiple sessions, not a live intraday institutional feed.
- Absorption ratio. The domestic offset measure compares the covered buying and selling. Read its window before interpreting it.
- Open FII DII Data and choose the cash-market view and observation window.
- Confirm the report date before reading the latest buy, sell and net values.
- Compare daily bars with the Nifty line and the cumulative flow for the same period.
- Use the separate derivatives or participant tools when the question concerns contracts rather than cash-market flows.
If FII net flow is -₹1,000 crore and DII net flow is +₹800 crore in a matching period, the domestic buying equals 80% of the foreign selling in that comparison. It does not prove that DIIs purchased directly from FIIs or that the market must rise.
Open the live tool. The arithmetic above is illustrative and is not a current market reading.
What is FII DII data?
FII DII data reports the daily cash-market activity of two groups of institutional investors on the National Stock Exchange: Foreign Institutional Investors (FIIs, a category that now includes all SEBI-registered foreign portfolio investors, or FPIs) and Domestic Institutional Investors (DIIs — mutual funds, insurance companies, pension funds and other domestic pools of capital). For each group and each trading session, the report publishes three numbers in ₹ crore:
- Buy value — gross shares bought by the group across the capital-market segment.
- Sell value — gross shares sold by the group.
- Net figure — buy minus sell. Positive net means the group was a net buyer that day.
Because FIIs and DIIs are the largest disciplined pools of capital in Indian equities, their combined net figures are watched daily as a proxy for institutional conviction — foreign money on one side, domestic money on the other.
Where does the data come from?
The source is the NSE report “FII/FPI & DII trading activity in the capital market segment”, published on nseindia.com after every trading session. Each broker reports its clients' trades to the exchange; NSE aggregates them by investor category and releases the end-of-day totals. The FII DII data page on JustTicks republishes the same end-of-day figures and adds period totals, monthly history, the NIFTY response and CSV export.
| Fact | Detail |
|---|---|
| Segment | NSE capital market (cash/equity) only — not derivatives |
| Frequency | One report per trading session, published end-of-day |
| Units | ₹ crore (1 crore = 10 million rupees) |
| Coverage | All NSE cash-market trades by FIIs/FPIs and DIIs |
How to read a day's FII DII report
Suppose the report shows FII buy ₹12,000 Cr, FII sell ₹13,500 Cr, DII buy ₹11,800 Cr and DII sell ₹10,200 Cr. The net figures are:
FII net = 12,000 − 13,500 = −₹1,500 Cr · DII net = 11,800 − 10,200 = +₹1,600 Cr
FIIs were net sellers and DIIs net buyers, with domestic flows slightly more than absorbing the foreign outflow. Three reading rules keep this honest:
- Net is a small difference of large numbers. Gross values can run above ₹10,000 Cr per side; a net figure is noise unless it is large relative to that base.
- Read both groups together. The FII–DII offset (absorption) plus the NIFTY response tells you whether risk is being redistributed or exited.
- Insist on persistence. Three to five sessions in the same direction carry far more information than any single day's print.
Quick check: FII selling + strong DII buying + NIFTY holding support = absorption. FII selling + weak DII buying + NIFTY breaking down = distribution. The same net number means different things in these two states.
FII vs DII: who they are and how they differ
| Dimension | FII / FPI | DII |
|---|---|---|
| Who | Global funds, sovereign funds, foreign portfolios registered with SEBI | Mutual funds, insurers, pension funds, domestic institutions |
| Mandate | Often benchmarked to India or EM mandates; sensitive to global rates and the dollar | Largely domestic mandates, SIP-driven inflows, insurance premiums |
| Typical behaviour | Faster risk-on/risk-off rotation; leader in selloffs and reversals | Steadier buyers; frequently absorbs FII selling |
| What flows tell you | Foreign appetite for Indian equity risk | Domestic liquidity cushion and support levels |
Their mandates differ enough that the two groups frequently sit on opposite sides: heavy FII selling absorbed by DII buying is one of the most common market-support patterns in Indian equities. To go one level deeper — who the “client” and “pro” categories are and how positioning differs from flows — read the participant wise open interest guide.
FII DII cash data vs FII derivatives data
The daily FII DII report covers the cash segment only. Foreign institutions also file a separate derivatives report, and NSE publishes FII activity in index futures, stock futures, index options and stock options — buy value, sell value, net and end-of-day open interest, in both ₹ crore and contracts. This is the dataset behind “FII derivatives data” and “FII options data” searches.
- Cash flows answer: did institutions buy or sell stock today?
- Derivatives positioning answers: are institutions carrying long or short exposure, and is it building or unwinding?
A trader reading FII selling in cash alongside rising FII short positioning in index futures reads a very different story from FII selling hedged by long futures. The FII DII data tool shows both tables for the latest session; the participant wise open interest tool extends the derivatives view to all four participant categories.
Limitations and common mistakes
- Aggregates hide strategy. One group's net figure nets off arbitrage, hedging and directional books; you cannot tell a hedged seller from a bear.
- End-of-day only. Figures are definitive only after the session; intraday estimates are projections.
- Stock-specific flows differ. The headline is market-wide; FII DII activity in a specific stock can run the opposite way (see FPI sector data).
- No dataset is a signal. Use flows as confirmation alongside price structure, breadth and volatility — never as a standalone trigger.