
What does the NSDL sector report contain?
For each sector, the report lists the total investment (AUM) foreign portfolio investors hold at the reporting date and the net investment made during the fortnight. Reporting dates fall mid-month and at month end, and the figures are published a few days after each date.
| Measure | What it is | Why it matters |
|---|---|---|
| Total AUM | Market value of FPI holdings in the sector | Shows allocation, which moves with prices as well as flows |
| Net investment | Purchases minus sales during the fortnight | Shows capital actually moving in or out |
AUM versus net flow
A sector's AUM can rise while foreigners are selling it, simply because share prices rose. Net investment strips that out and shows the cash movement. Reading both together separates a price-driven change in allocation from a genuine change in positioning.
Reading sector rotation
- Net / AUM expresses the fortnight's net flow as a share of the sector's AUM, so large and small sectors can be compared.
- Change versus the previous report shows whether a sector's flow is improving or weakening, and a turnaround marks a flip from outflow to inflow or the reverse.
- 12-fortnight hit rate and Flow Z show whether the latest flow is unusual against its own recent history.
- One-year net flow sums the last 24 fortnights and shows the structural direction.
- Breadth counts how many sectors saw inflows against outflows, and concentration shows how much of AUM sits in the top three sectors.
How it differs from FII DII data
The daily FII DII table reports cash-market buying and selling by institutional category and is published after each session. The NSDL sector report is fortnightly, covers FPI holdings and flows by sector, and includes more than equity trades. The two measure related but different things and will not match.
Limits and common misreads
- It is delayed. The data describes a date that is already several days old when published.
- Sector mapping is NSDL's classification, which can differ from index or exchange sector definitions.
- Flows can reflect currency, tax or index-weight events rather than a view on a sector.
- Net flow is a total across many managers, so offsetting views are hidden.
Use it as context alongside price, breadth and valuation. Nothing here is investment advice.
How to use the FPI Sector Data
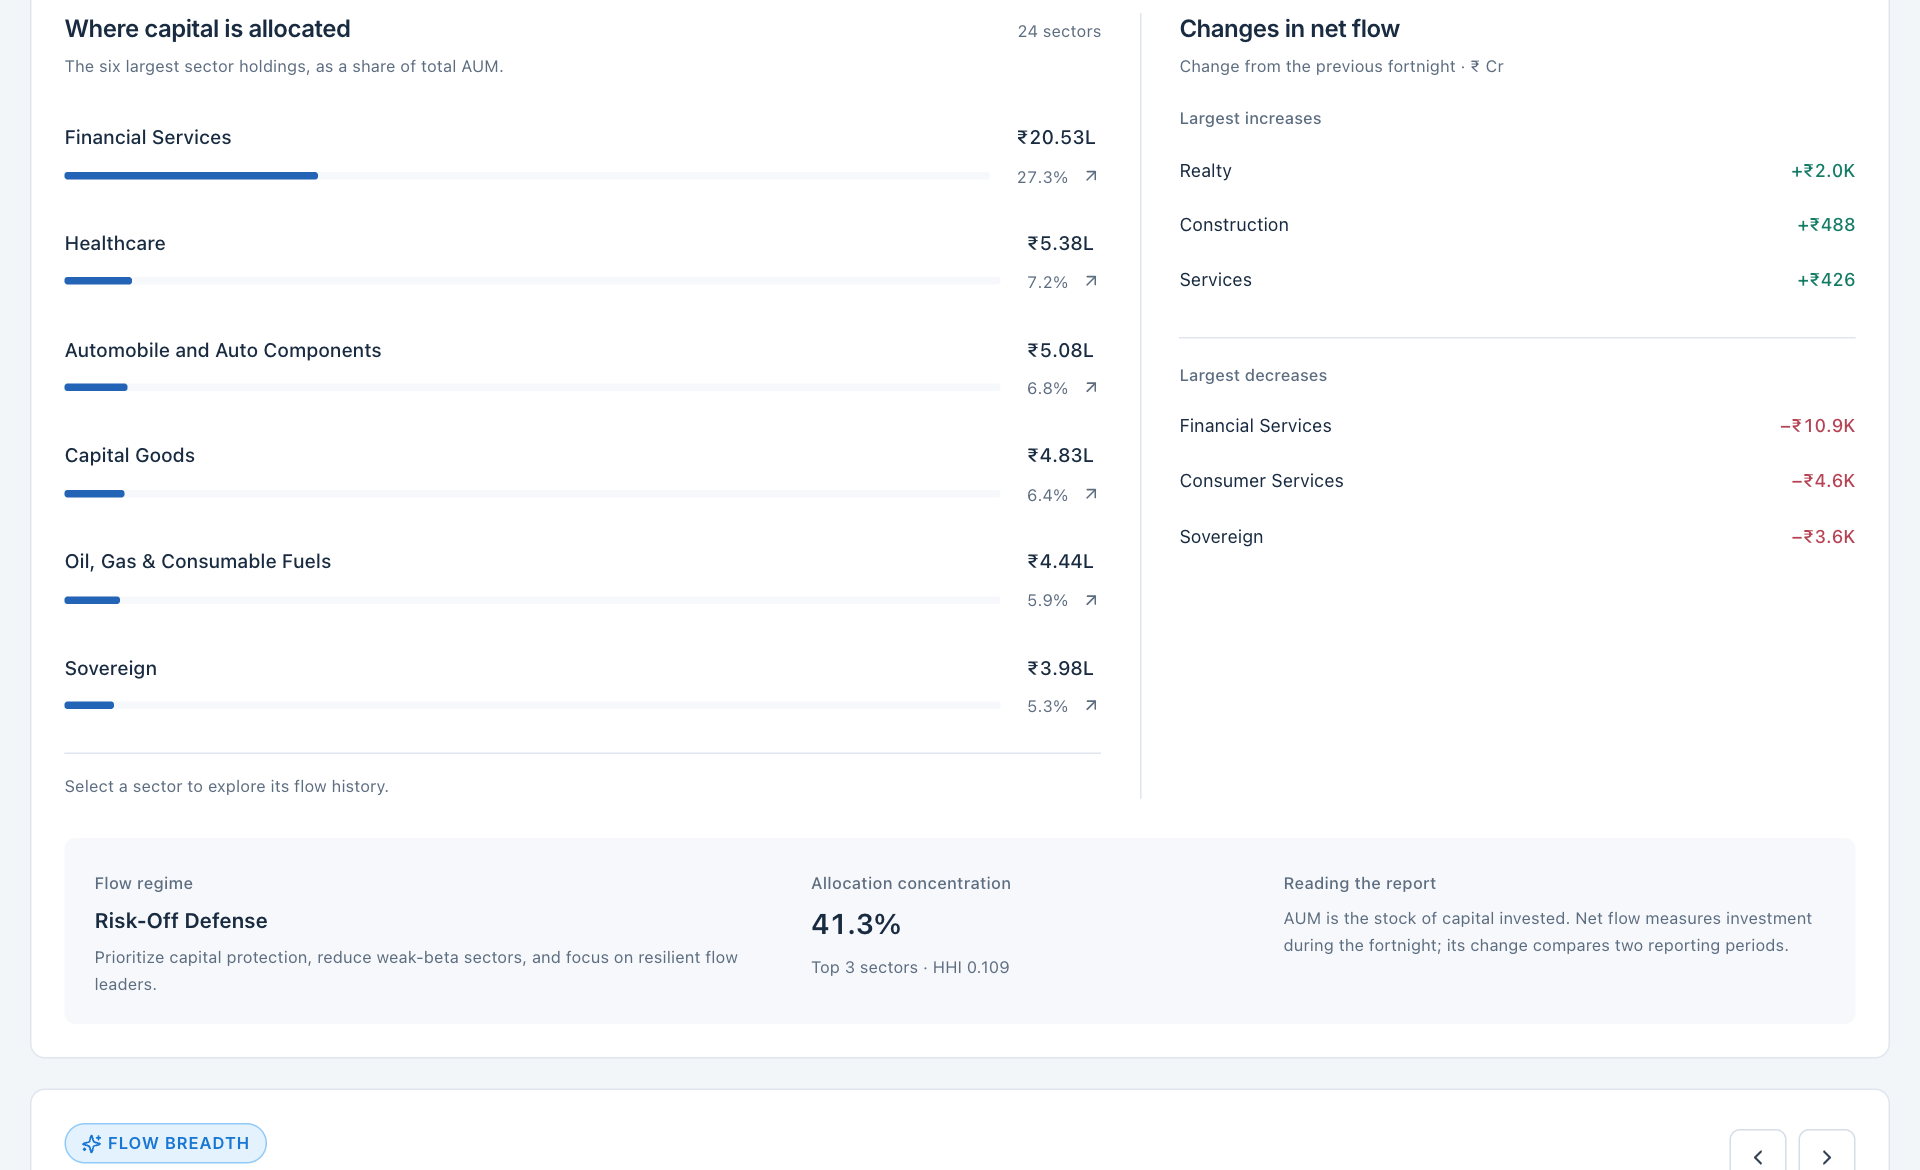
- AUM allocation. This side shows the stock of reported holdings, not the fortnight net investment.
- Change in net flow. This column compares two reporting periods; it is different from the latest flow itself.
- Sector weights. Read sector AUM with its share of total holdings.
- Allocation concentration. The share held by the largest sectors measures concentration, not return or liquidity.
- Choose the reporting period in the FPI Sector Data tool.
- Compare sector AUM and net investment without treating them as the same measure.
- Inspect the previous-period comparison and the longer history for persistence.
- Open a sector history and compare it with the separately measured sector price performance.
Read a numerical example
If sector AUM rises from ₹1,000 crore to ₹1,050 crore while net investment is -₹20 crore, the higher AUM cannot be described as ₹50 crore of net buying. Market-value changes and reported flows measure different things.
Illustrative arithmetic only; this is not a current signal or a trade recommendation.