
Choose the tool for the question
| Question | Tool | Learn the workflow |
|---|---|---|
| What does a selected call plus put cost? | Straddle Chart | Read the chart and legs |
| How does ATM premium change as spot moves? | Rolling ATM Straddle | Understand strike switches |
| What changes when call and put strikes differ? | Strangle Chart | Compare strangles and straddles |
| How do two strikes in one expiry compare? | Spread Chart | Read a vertical spread |
| How do near and far expiries compare? | Calendar Spread | Read the expiry difference |
| What is the position's payoff and exposure? | Strategy Builder | Model legs and scenarios |
A premium-chart workspace
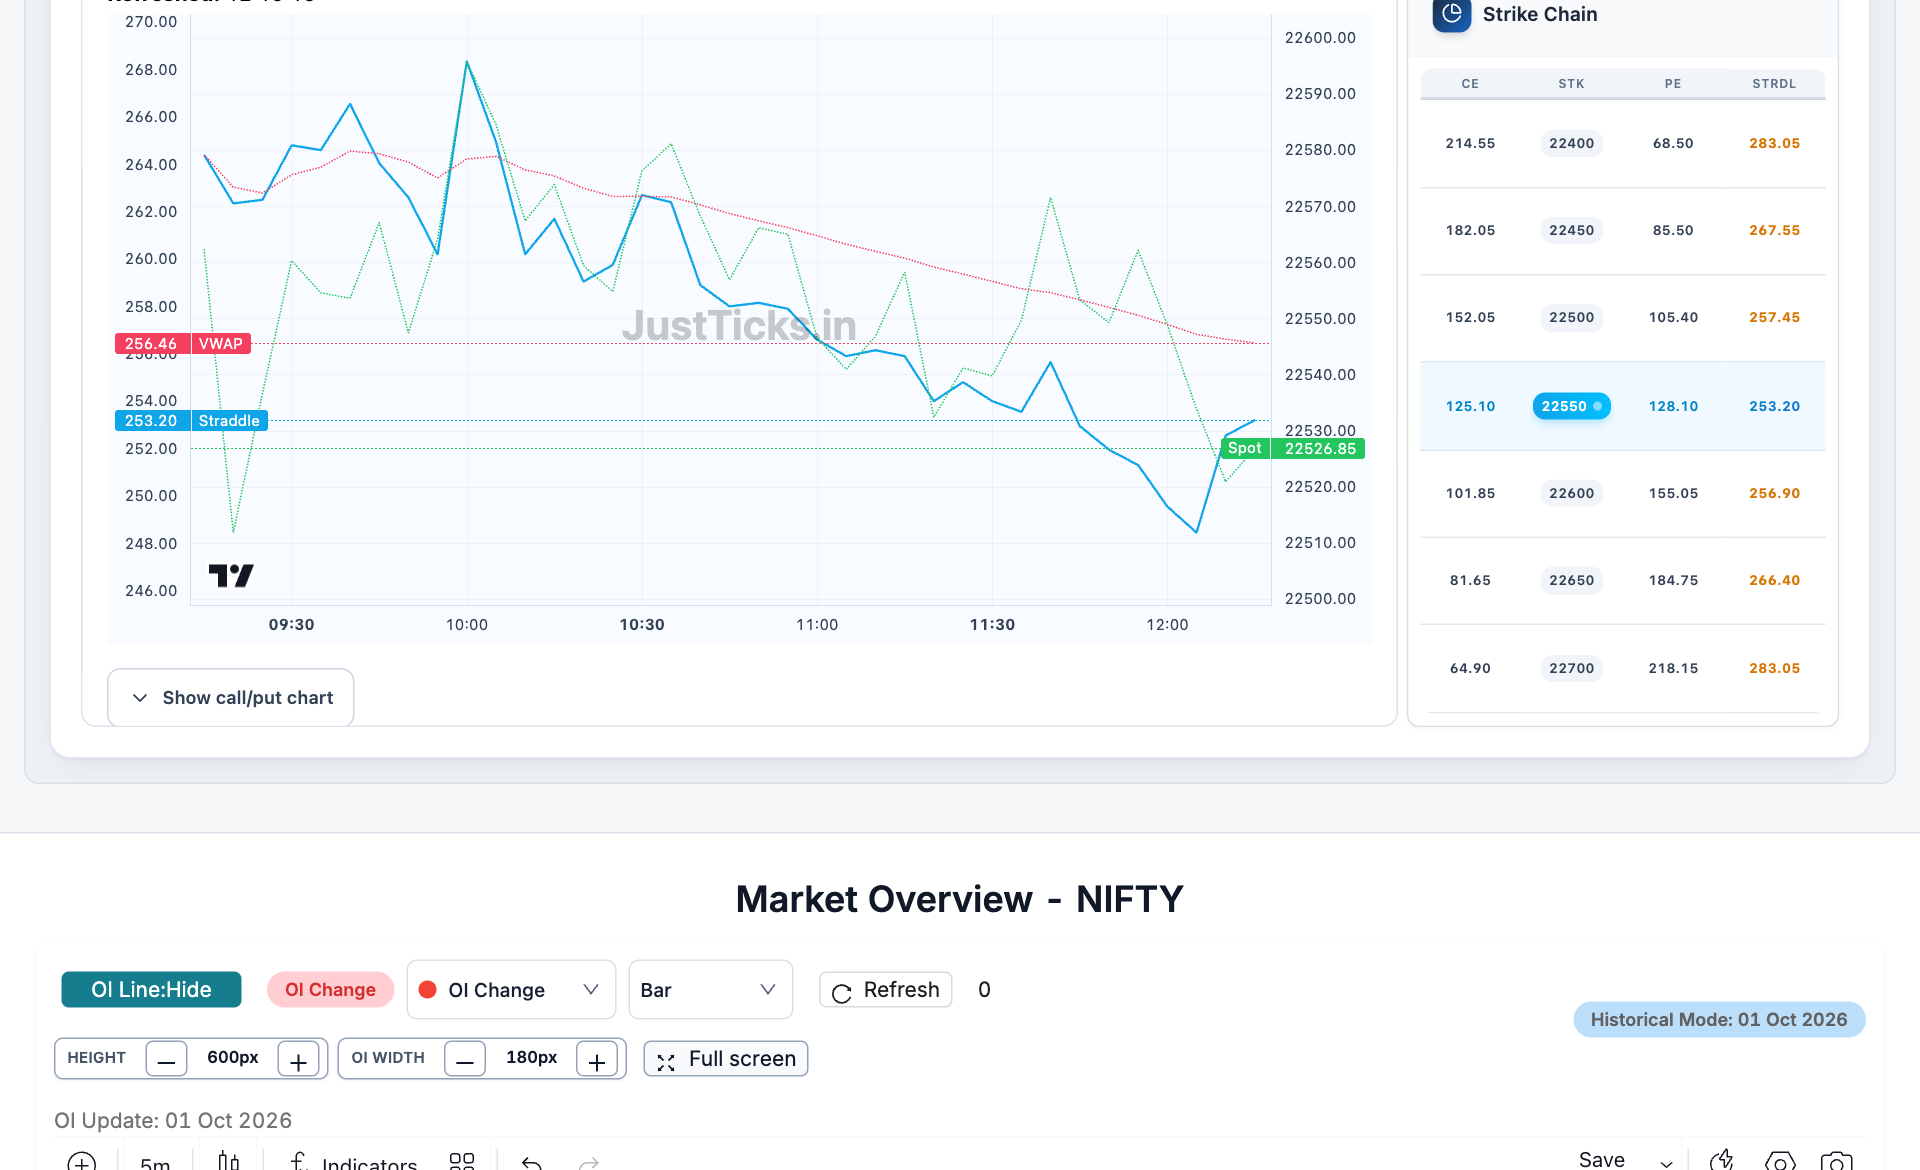
- Check both legs. The selected strike row shows CE 125.10 plus PE 128.10, which equals 253.20 points.
- Combined premium. This is the observed call-plus-put price, not profit from a long or short position.
- Session VWAP. VWAP is a same-session reference rather than your own entry price.
- Separate spot axis. Spot uses index points on the right; a line crossing does not make it equal to the premium.
This is one premium workspace in the family. Use the individual guides for its controls and the Strategy Builder guide for multi-leg payoff scenarios.
A repeatable analysis workflow
- Define the measurement: a contract premium series, an expiry payoff or a pre-expiry scenario. Choose the corresponding tool from the table.
- Confirm the underlying, each strike and each expiry. Fixed-strike and rolling-ATM series are different datasets.
- Read the observation time and the separate CE and PE prices. A last traded price can be stale and need not be an executable quote.
- In a position model, check buy or sell, lots and entry premiums for every leg. Long and short versions of the same structure reverse the payoff.
- Compare price, time and IV scenarios. An expiry payoff diagram does not describe every possible pre-expiry mark-to-market value.
- Use the detailed structure guide to understand assumptions before comparing another strategy.
Worked example: premium is not position profit
Suppose a call and put share strike 25,000 and the same expiry. Their illustrative premiums are 100 and 80 points, so the combined premium is 180 points. A long straddle's expiry breakevens are 24,820 and 25,180 before costs. The maximum expiry loss is the 180-point debit when the underlying finishes at the strike.
If the combined market premium later reads 150, the chart alone does not state the position's total result. A buyer who paid 180 has a 30-point mark-to-market loss before costs; a seller has the opposite premium movement, with a different risk profile. Currency P&L also needs the applicable contract quantity.
These figures are illustrative. Check the instrument's actual contract specifications and do not confuse a displayed expiry payoff with an available execution price.
Connect premium charts to Greeks and PCR
Use the option Greeks learning path to understand price, time and IV sensitivity. Use the PCR learning path for outstanding positioning and trading-activity ratios. PCR does not determine the payoff of a straddle, and a falling premium line does not identify the trader on either side.
Structure definitions
The Options Industry Council's strategy library explains standard option structures. JustTicks guides add the controls and chart conventions used by this application. Contract settlement, lot sizes, access and available history depend on the selected instrument and workspace.