
What is an option chain?
An option chain is a table of every listed call and put for one underlying and one expiry, arranged by strike price. Calls are shown on one side and puts on the other, with the strike in the middle, so you can read the whole market for that expiry across a single row. Each side lists the option's last traded price, volume, open interest, the change in open interest and implied volatility.
The live Nifty option chain follows this layout and adds derived columns such as breakeven, a buildup signal, the put and call balance and a straddle value, with a replay of how the chain developed through the day.
In, at and out of the money
| Strike vs spot | Call | Put |
|---|---|---|
| Strike below spot | In the money (ITM) | Out of the money (OTM) |
| Strike closest to spot | At the money (ATM) | At the money (ATM) |
| Strike above spot | Out of the money (OTM) | In the money (ITM) |
Most analysis starts at the ATM strike and moves outward, because that is where the option premium is most sensitive to price and where the largest share of trading and open interest usually sits.
What each group of columns tells you
LTP, volume and IV
Price and activityLast traded premium, contracts traded today and implied volatility for each option. Volume shows where activity is; implied volatility shows how expensive the option is relative to its risk.
OI and OI change
PositioningOutstanding contracts at each strike and how they changed. This is the core of most option chain analysis: where positions sit and where they are being added or closed.
Signal and breakeven
Derived columnsThe signal labels the option's premium and open interest movement as buildup, covering or unwinding. Breakeven shows the underlying level at which a buyer of that option is even at expiry.
PE − CE difference, PCR and straddle
Balance and costThe put and call balance at each strike, and the combined premium of a call and put at the same strike. Together they show how positioning tips between the sides and what the market is paying for movement.
Choose the view for your question
Start with a single expiry and observation time. Move to a specialist view when the question needs a different comparison; changing the view does not make the underlying measurements interchangeable.
| View | What to inspect |
|---|---|
| Options Data walkthrough | Compare strike-level OI, OI change, volume and PCR in a selected session and replay window. |
| Option Chain walkthrough | Read a single-expiry call and put chain with premium, OI, OI change, volume, IV and historical session controls. |
| Combined Weekly Option Chain walkthrough | Compare selected available expiries side by side on one call/put strike ladder, with premium, OI, OI change and volume. |
| Advance Option Chain walkthrough | Compare call and put premium, OI, OI change, volume, IV and derived reference fields on one strike table. |
| Timeseries Option Chain walkthrough | Compare strike-level option observations across timestamps, with measure, transpose, cumulative and Greeks controls. |
| Max Pain walkthrough | Inspect the selected expiry’s minimum-payout strike, payout distribution and available max-pain history. |
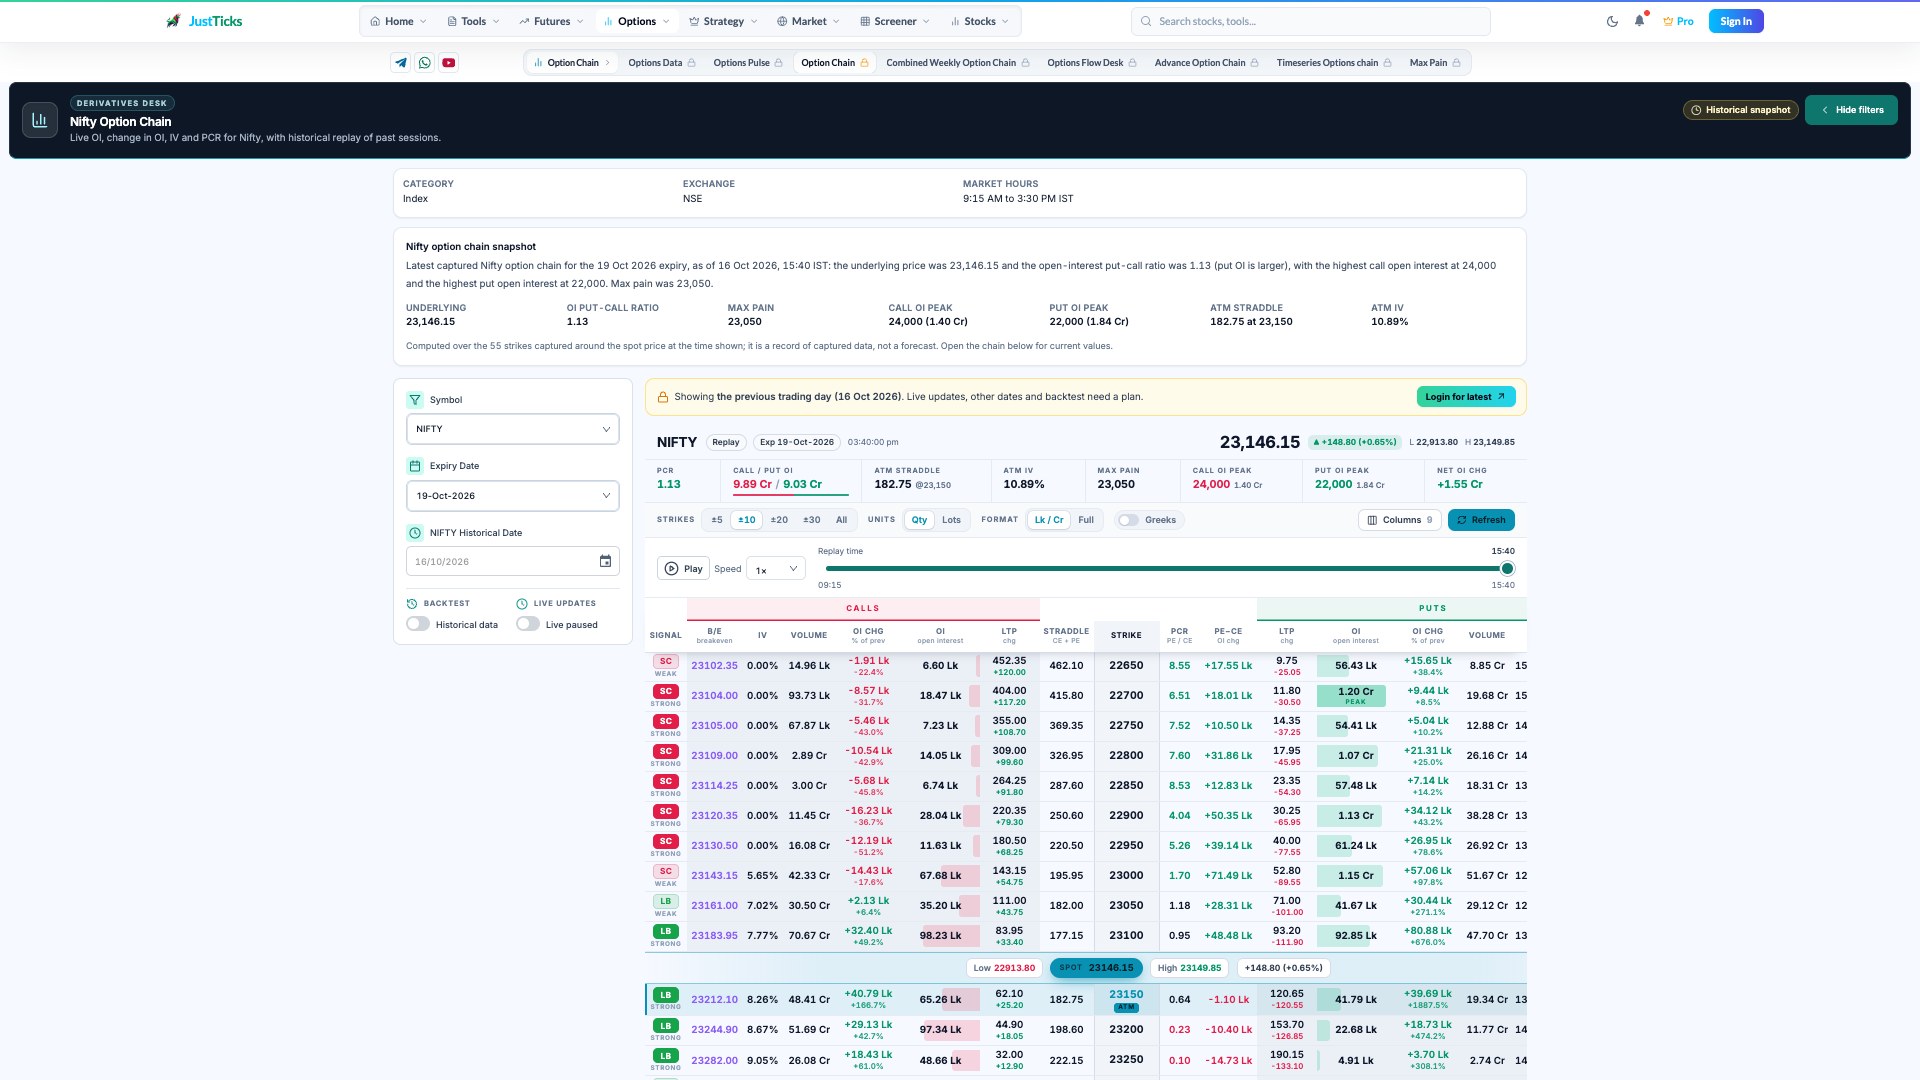
- Select the contract. Confirm the instrument, expiry and pictured source session.
- Check snapshot freshness. The summary records a captured observation, not an executable live quote.
- Replay the session. The timeline selects an observation within the pictured session.
- Read matched strikes. Compare CE and PE fields across the same strike row.
Reading open interest across the chain
Open interest is the most watched column. Large call open interest above spot and large put open interest below it are commonly read as potential resistance and support zones, although OI does not identify who initiated the positions or whether anyone will defend a level. Change in open interest shows net additions or reductions relative to the stated reference, not whether a price level will hold. The call vs put OI guide covers this in more detail, and the call vs put OI chart draws it strike by strike.
Buildup labels: read the option, not the index
| Option premium | Open interest | Label |
|---|---|---|
| Rising | Rising | Long buildup |
| Falling | Rising | Short buildup |
| Rising | Falling | Short covering |
| Falling | Falling | Long unwinding |
The labels apply to the option itself. A short buildup on a call means that call's premium fell while its open interest rose, which often points to call writing and is read as resistance. The same label on a put often points to put writing and is read as support. Strong or Weak describes how large the change is relative to others, not how reliable the signal is.
Implied volatility, breakeven and the straddle
Implied volatility (IV) is backed out of an option's price and shows how much movement the market is pricing. Comparing IV across strikes shows how risk is priced on each side; out of the money puts often carry higher IV than equivalent calls because of demand for protection.
The breakeven of an option is the underlying level at which a buyer is even at expiry: the strike plus the premium for a call, or the strike minus the premium for a put. The straddle value adds the call and put premiums at one strike. At the ATM strike it is a rough gauge of the movement the market is pricing in until expiry, which you can compare with where the underlying has recently been trading. It is built from last traded prices and is a guide, not a forecast. The straddle chart tracks it over time.
A step-by-step routine
- Pick the underlying and expiry. Near-term expiries carry most of the short-term positioning.
- Find the ATM strike. Everything else is read relative to it.
- Find the open interest walls. Note the largest call open interest above spot and put open interest below it.
- Check the change. See where open interest is being added or removed now, and read the buildup label on the option, not on the index.
- Compare IV and the straddle. Note whether the market is pricing more or less movement than usual.
- Replay the sequence. Step through the day to see how the picture formed instead of judging one snapshot.
- Confirm with price. Treat the chain as context, and act only when price action agrees.
Limitations and common misreads
- Open interest has two sides. The chain cannot tell you who initiated a contract, so writing and buying are inferences from premium and open interest changes.
- Hedges and spreads look like views. A protective put or a spread leg adds open interest without a directional call.
- Snapshots are periodic. The chain updates at intervals, so fast moves can be smoothed over; keep the observation time consistent when comparing.
- Premium is not only direction. Implied volatility and time decay can dominate an option's price movement, so a rising premium does not always mean the underlying rose.
- Units differ. Open interest may be shown in contracts or in underlying quantity; check the units before comparing instruments.