
What this tool helps you investigate
Use India VIX to inspect changes in option-implied market uncertainty and compare the current level with its recent history. The tool provides a chart and interval OHLC records.
India VIX is an annualised volatility index derived from Nifty options. Higher implied volatility describes greater expected variability; it does not establish whether Nifty will rise or fall.
Read the workspace
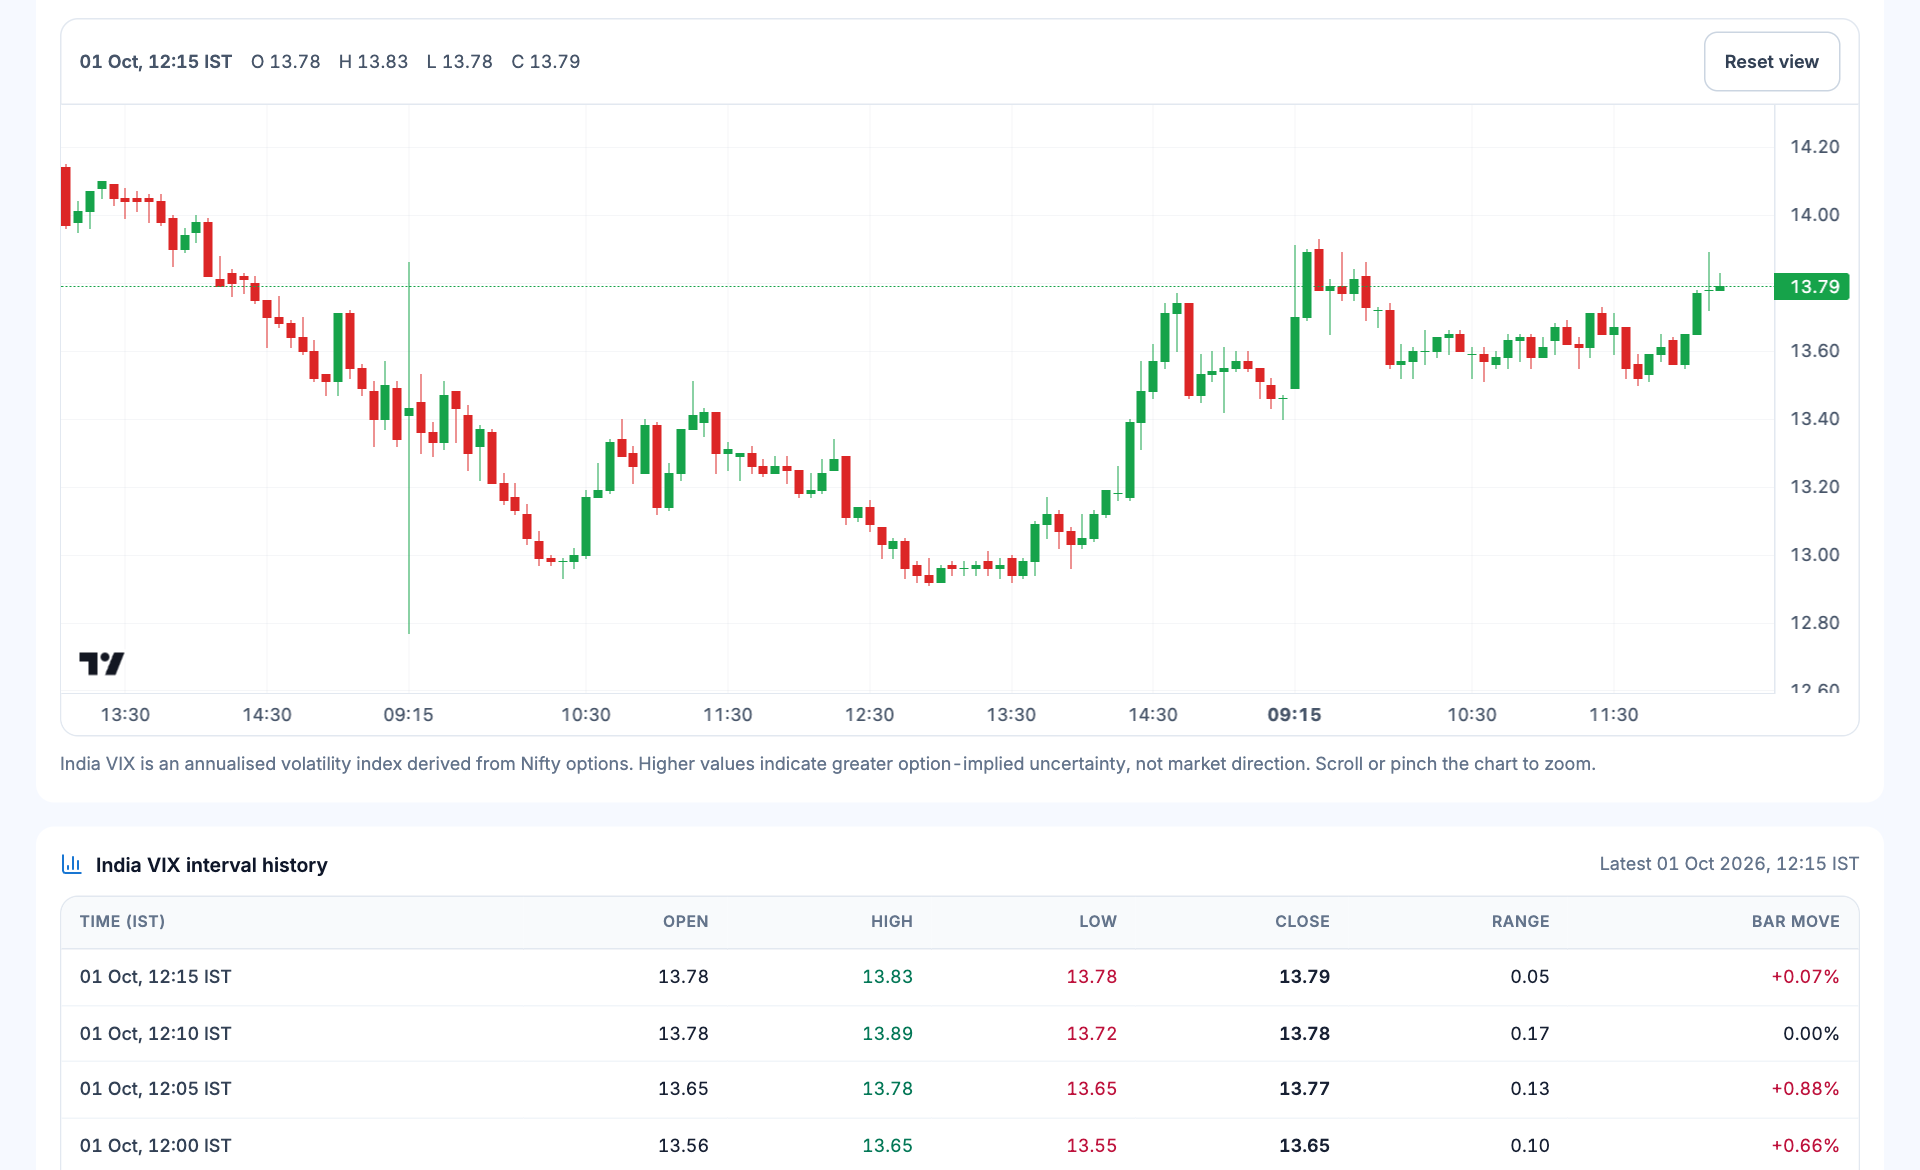
- Bar timestamp and OHLC. The header identifies the chosen sampled bar and its volatility values.
- VIX reading. This value is a volatility index level, not a predicted market return.
- Session structure. Use the time axis to distinguish overnight boundaries and intraday changes.
- OHLC history. The interval table separates the bar range from its percentage movement.
How to use India VIX
- Read the latest source timestamp and the chart interval.
- Compare the current VIX level with preceding sessions, not only the last candle colour.
- Inspect a change in the OHLC table to separate the bar range from the closing move.
- Use volatility context alongside price and positioning tools rather than replacing them.
Understand the measurements
| Measurement | How to read it |
|---|---|
| VIX level | Annualised option-implied volatility index reading. |
| Open/high/low/close | Observed volatility values inside the selected interval. |
| Range | Difference between the interval high and low. |
| Bar move | Percentage change for that volatility bar; different from the VIX level itself. |
A worked example
A move from 12 to 15 is a three-point increase in the VIX level and a 25% relative rise in that level. It does not mean Nifty is expected to fall 25%, nor does it specify a direction.
This example explains the calculation or reading process. It is not a current market observation or a trade recommendation.
Checks before drawing a conclusion
- Distinguish volatility-index points from the percentage change in the index.
- Annualised volatility is not the expected daily percentage move.
- Compare the same timestamps and intervals when relating VIX to an index chart.
Index methodology
The NSE India VIX methodology explains the options-based volatility index. The guide above describes how to read the JustTicks interface.