
What this tool helps you investigate
Use constituent charts after identifying a strong or weak index to examine whether several underlying stocks share a price pattern. The tool places four timeframes alongside each other.
A five-minute recovery can occur inside a declining daily structure. Reading the panels together avoids treating a local rebound as evidence that every timeframe has turned.
Read the workspace
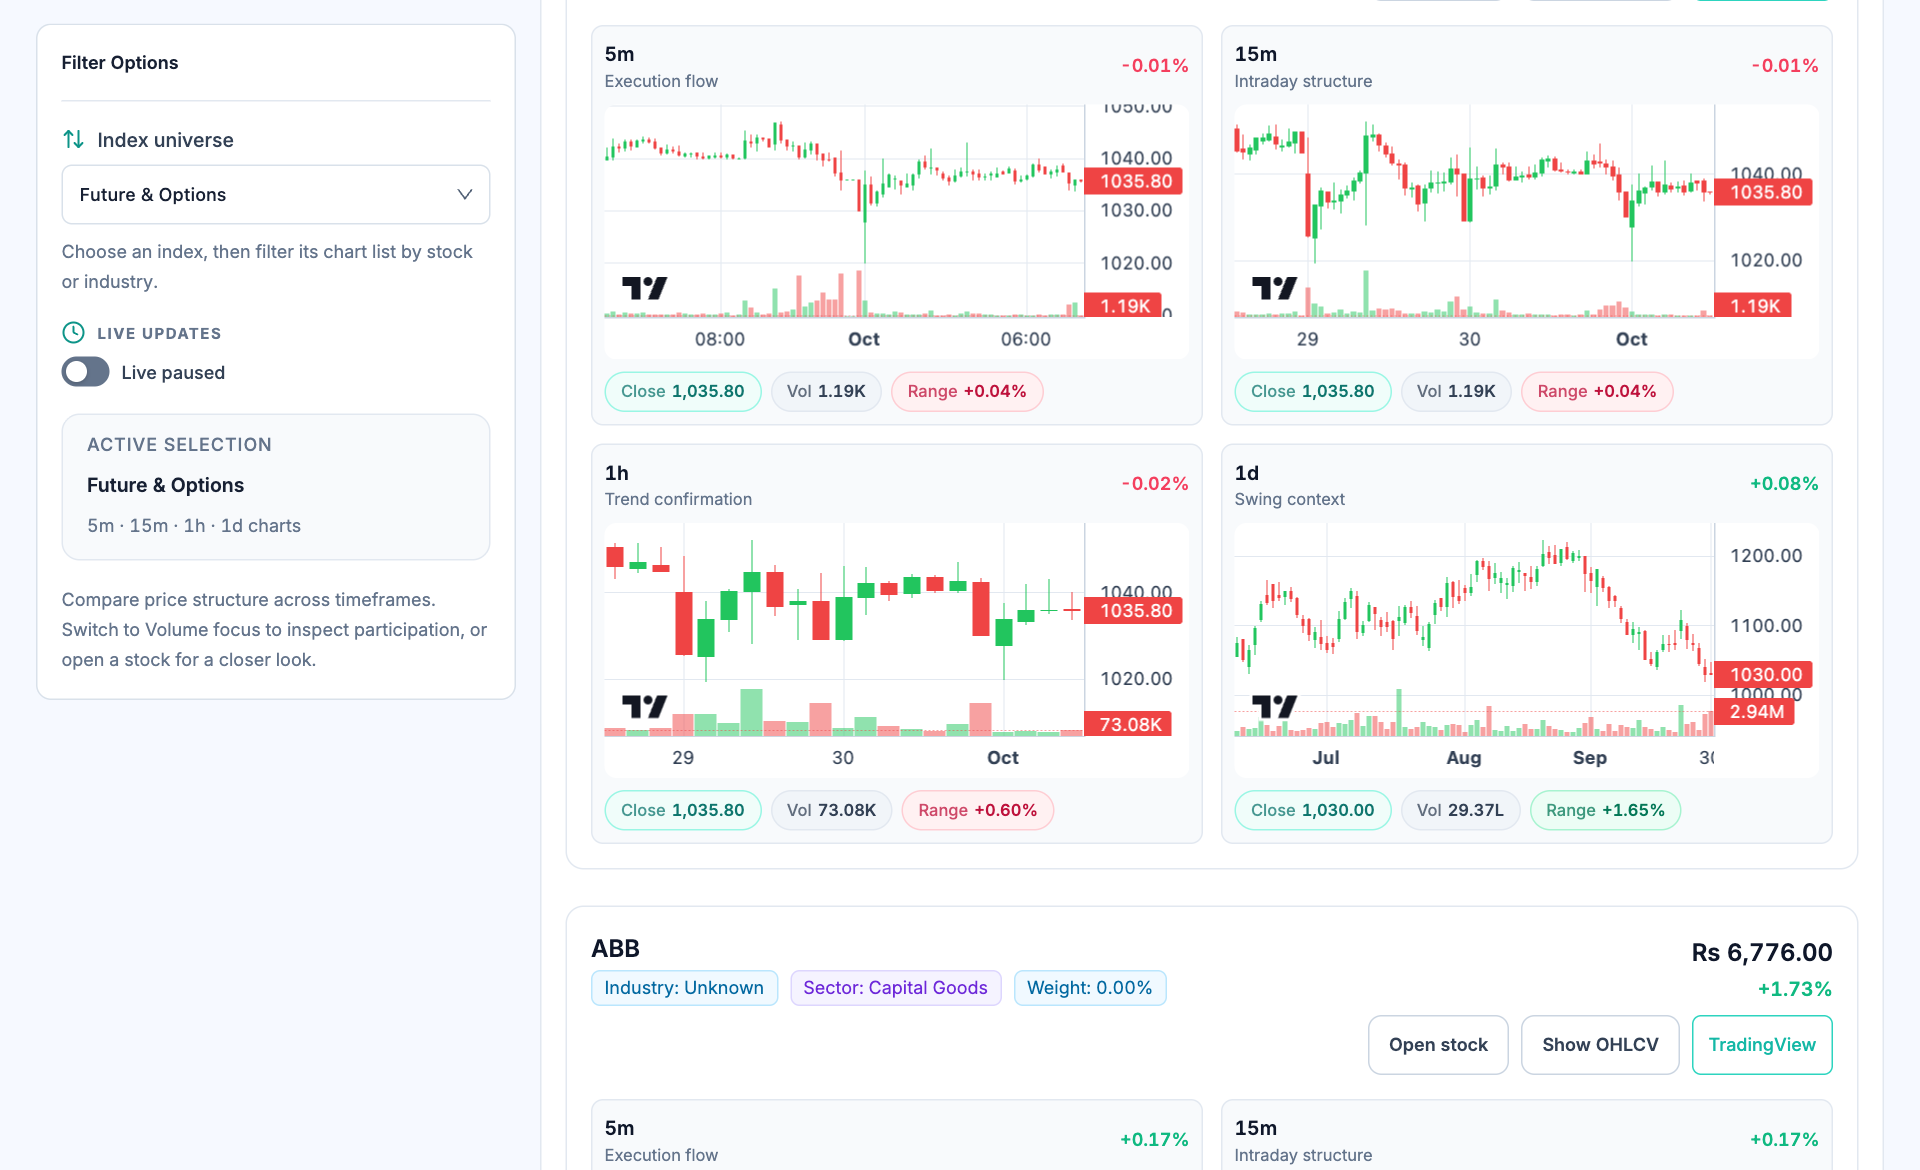
- Universe selection. Choose an index or the F&O universe, then narrow its constituent list.
- Five-minute chart. The shorter chart shows local structure; read its candle interval before comparing it with another panel.
- Daily context. The daily chart provides a longer price history than an intraday panel.
- Open stock controls. Use the row actions for a closer stock view or its OHLCV data.
How to use Index constituent charts
- Choose the index universe and narrow the list by stock or industry where available.
- Start with the daily panel to establish the broader price range.
- Compare hourly, 15-minute and five-minute structure for the same constituent.
- Inspect volume and use Open stock or OHLCV for the next level of detail.
Understand the measurements
| Measurement | How to read it |
|---|---|
| Candle interval | Each panel aggregates a different duration; candle counts are not directly comparable. |
| Close | The closing value of the displayed bar, whose timestamp may differ across panels. |
| Volume | Traded quantity over that panel interval. |
| Range | The displayed bar movement or range should be read with its panel context. |
A worked example
A constituent may show a rising five-minute sequence but remain below the previous daily swing high. Record both observations: the intraday recovery is visible, while the longer-term level remains overhead. The two views need not agree.
Worked example
This example explains the calculation or reading process. It is not a current market observation or a trade recommendation.
Checks before drawing a conclusion
- Match stock identity and chart timestamps across panels.
- Different intervals naturally have different volume totals.
- Incomplete current bars can change until their interval closes.