
What this tool helps you investigate
Use sector performance to compare how mapped groups of stocks behaved over the selected return window. The decision table adds constituent participation so a sector average is not read alone.
Relative leadership can exist on a falling day. The least-negative sector may lead the comparison while its own constituents still decline.
Read the workspace
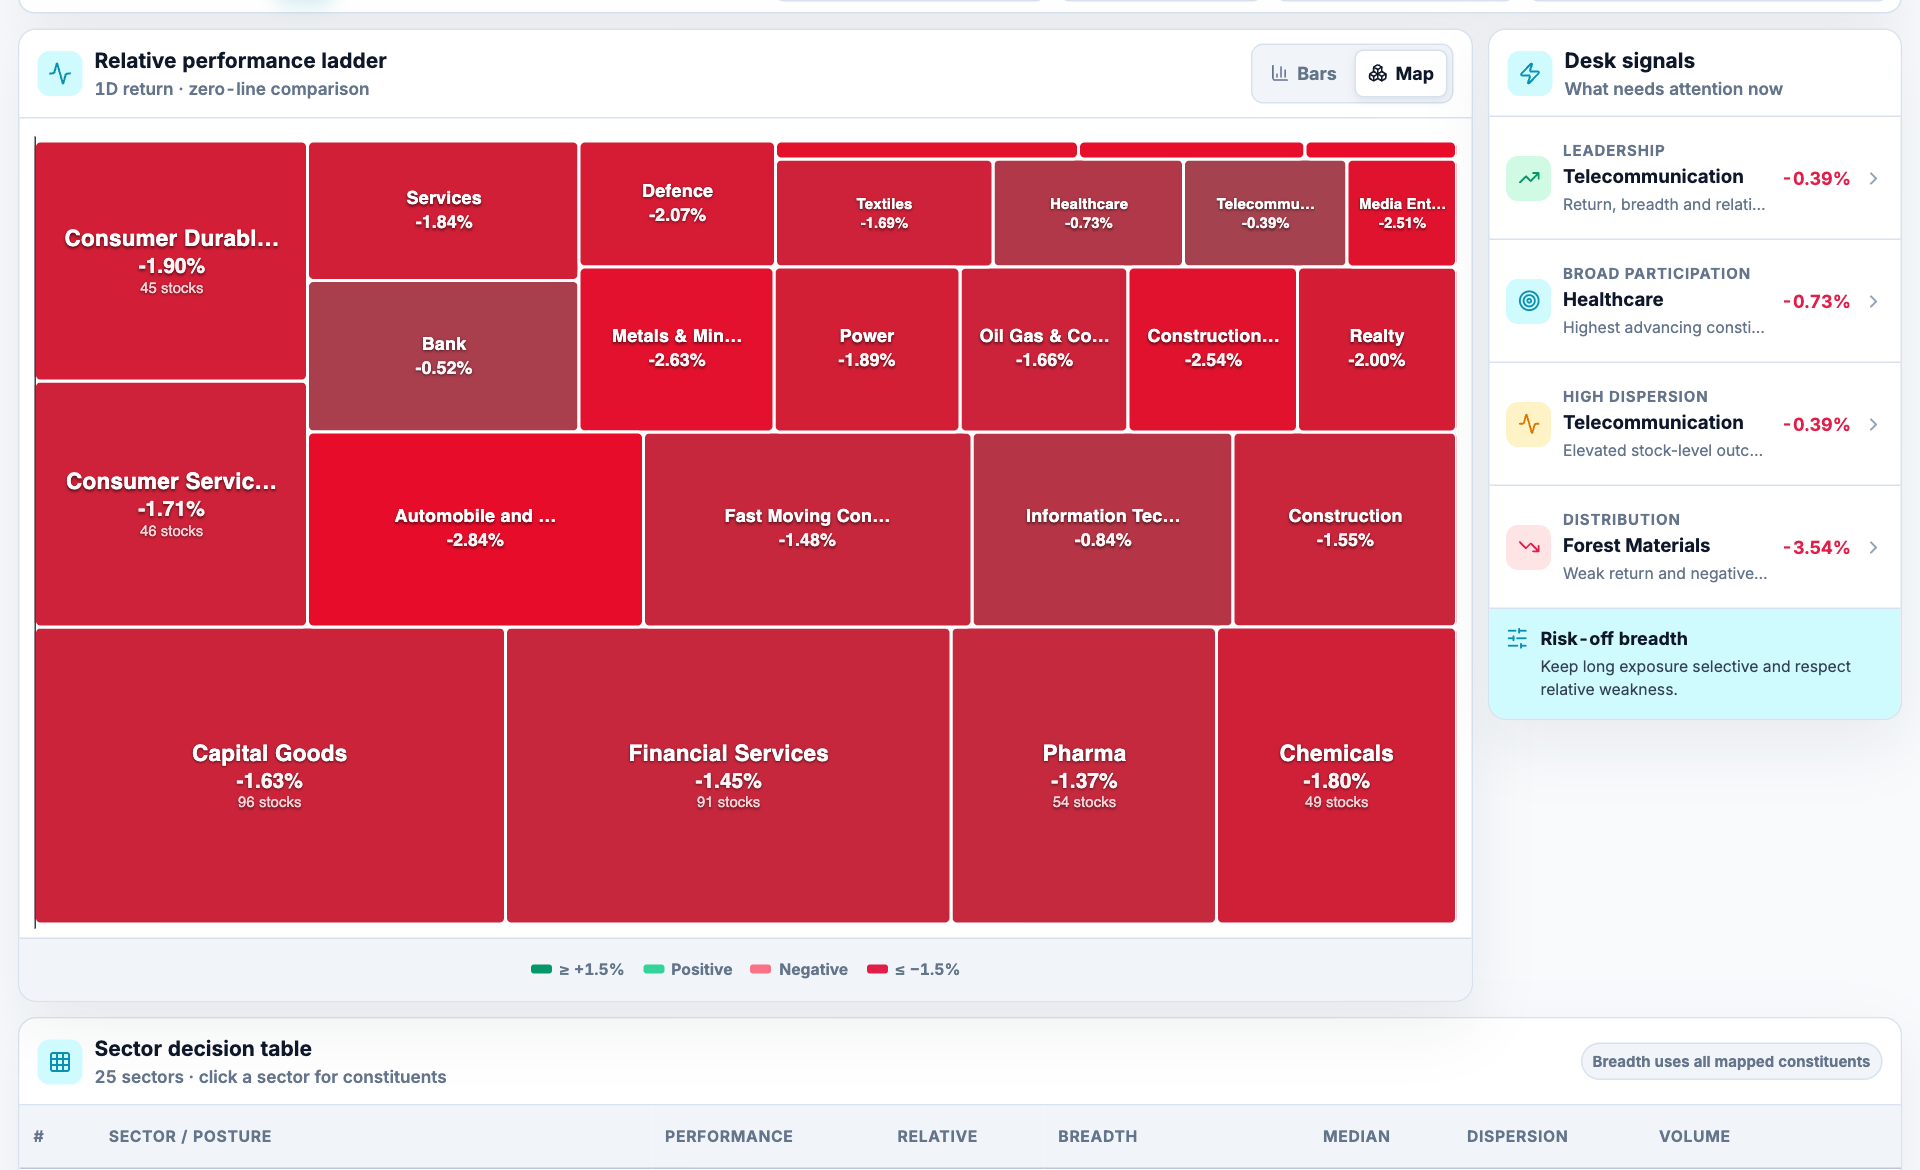
- Map or bars. Switch the presentation without changing the selected return window.
- Sector return. Read the percentage label; a large tile or strong colour is not a direct fund-flow measurement.
- Desk signals. Summary labels highlight relative leadership and participation inside the current comparison.
- Decision table. Use the table to compare return, relative performance, breadth, median and dispersion.
How to use Sector performance
- Select the comparison period and universe in the tool.
- Compare the sector return with the median constituent return.
- Check breadth and dispersion to see whether the move is shared or uneven.
- Open a sector to inspect its constituents before moving to an individual stock.
Understand the measurements
| Measurement | How to read it |
|---|---|
| Performance | The sector return over the selected window. |
| Relative performance | Sector performance versus the comparison baseline shown in the tool. |
| Breadth | The share or count of constituents meeting the displayed advancing condition. |
| Dispersion | The spread of constituent returns; high dispersion means the sector label hides diverse moves. |
A worked example
Sector A returns -0.4% while Sector B returns -2.0%. A leads by 1.6 percentage points. If only two of ten A constituents advance, describe it as relative resilience with weak breadth rather than broad accumulation.
Worked example
This example explains the calculation or reading process. It is not a current market observation or a trade recommendation.
Checks before drawing a conclusion
- Compare the same observation window and constituent mapping.
- A sector return is not evidence of institutional cash inflow.
- Small sectors and outlier stocks can distort averages.