
What this tool helps you investigate
Use the options OI dashboard to scan activity across a selected market universe before opening one underlying option chain. Filters cover active value, strike volume, OI gainers or losers, price behaviour, PCR and moneyness.
A row is an option contract or selected strike-side observation, not necessarily one unique underlying stock. The same symbol can appear repeatedly at different strikes and on both call and put sides.
Read the workspace
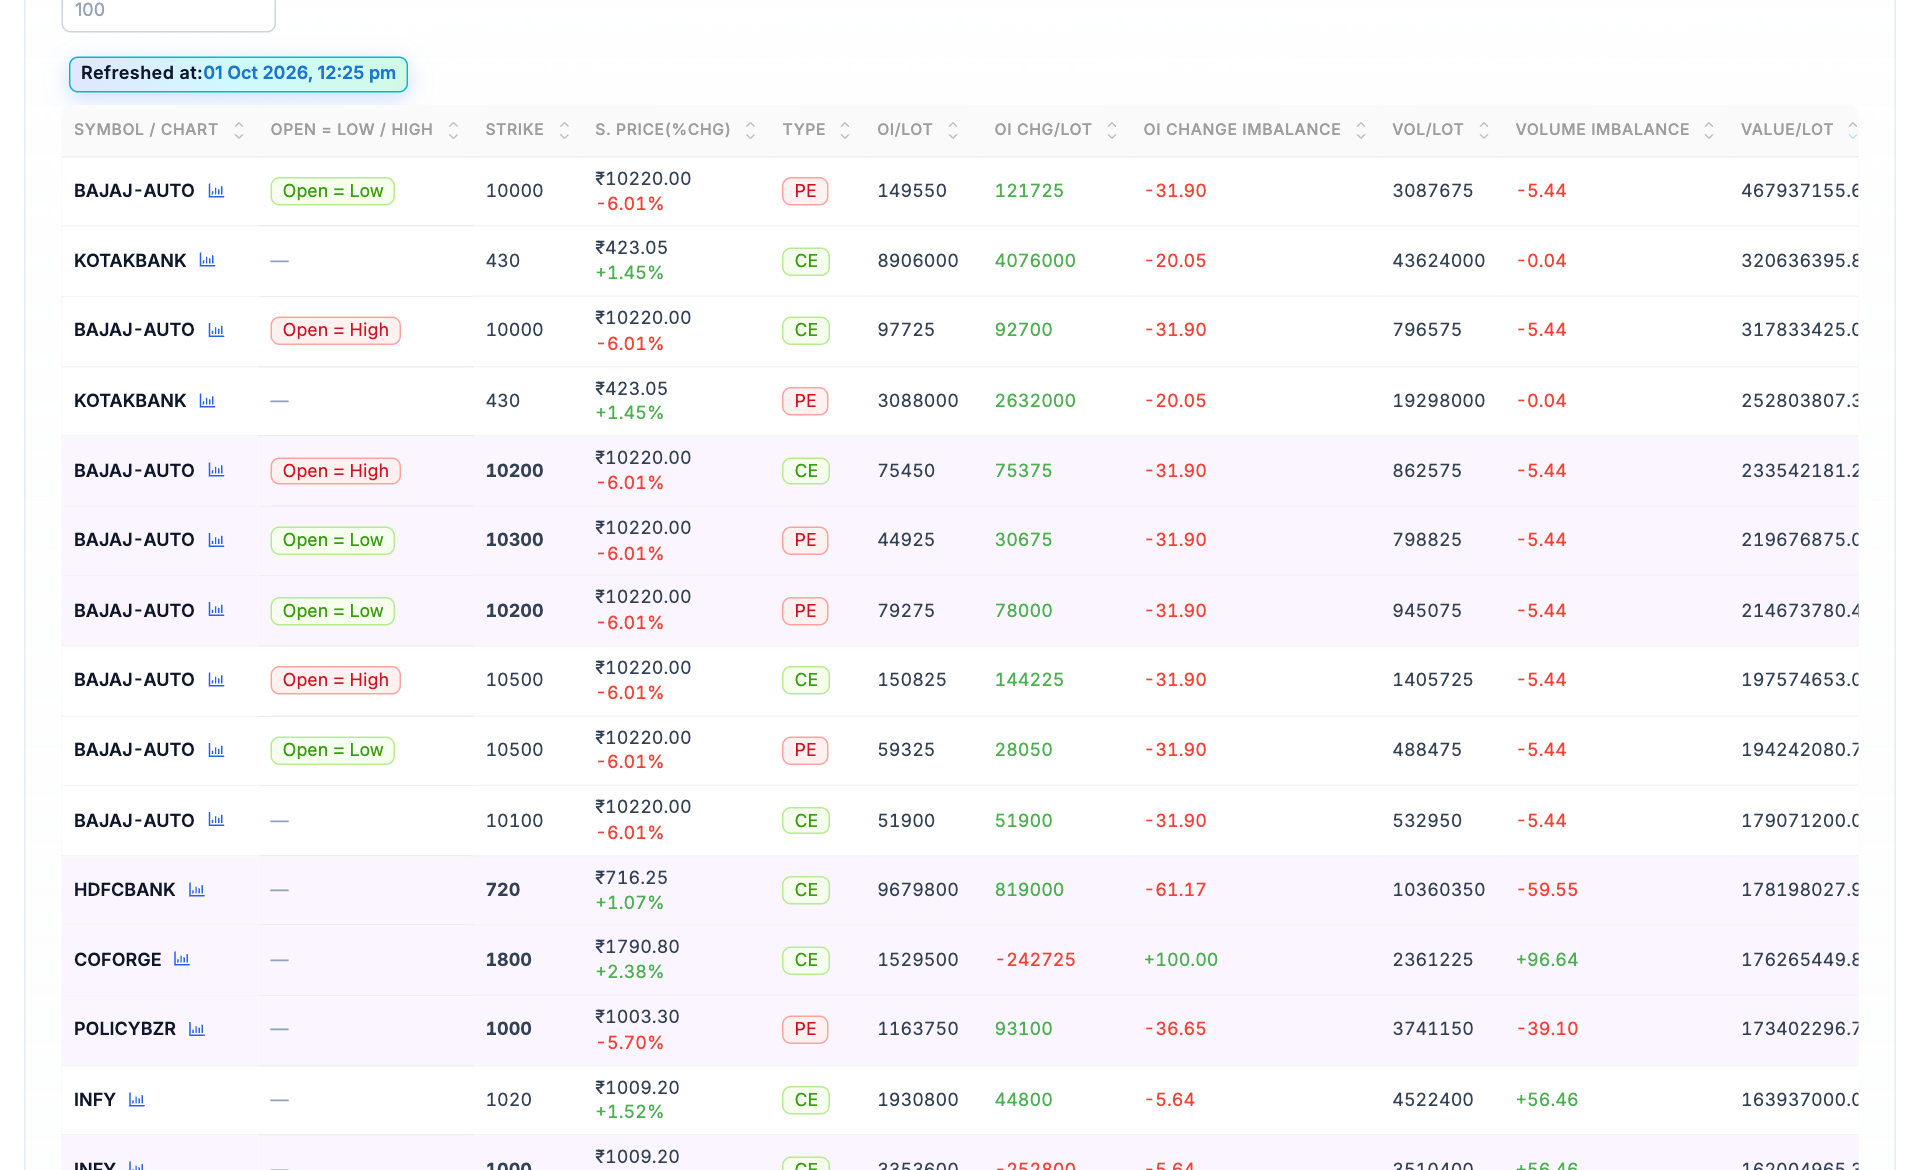
- Refresh timestamp. The table belongs to the last observed refresh; check it before describing activity as current.
- Contract identity. A symbol can appear on several rows because strike and CE/PE define different contracts.
- OI and OI change. Outstanding OI and its change are different measures. Read the column units and baseline.
- Volume and imbalance. Activity and side imbalance use different calculations; a negative imbalance is not a negative traded quantity.
How to use Options OI dashboard
- Select the market universe, expiry and comparison timeframe.
- Choose a screener condition that matches the question, such as OI gainers or active strike volume.
- Read the symbol, strike and CE/PE side before comparing quantities.
- Check OI change, volume and imbalance together, then open the underlying chain for price, expiry and liquidity context.
Understand the measurements
| Measurement | How to read it |
|---|---|
| Strike and type | The option strike and call or put side identify the contract. |
| OI | Outstanding option position quantity in the displayed units. |
| OI change | Position quantity change from the selected comparison reference. |
| Volume and imbalance | Traded activity and the tool side-comparison metric, which must not be treated as the same quantity. |
A worked example
If one underlying appears in four rows at two strikes with CE and PE on each strike, it is still one underlying and four option observations. Counting four rows as four independent stocks would overstate market breadth.
This example explains the calculation or reading process. It is not a current market observation or a trade recommendation.
Checks before drawing a conclusion
- Read the universe, expiry, timeframe and refresh time before comparing results.
- Rows can repeat an underlying across strikes and sides; row count is not stock breadth.
- OI and imbalance cannot identify an investor or establish whether the complete position is directional or hedged.