
What this tool helps you investigate
Use the index heatmap to locate relative strength and weakness across broad-market and sector indices in one session. It is a market overview rather than a ranking of individual stocks.
An index can rise while many of its constituents fall. After finding a strong tile, examine its constituent breadth and contributors to determine whether leadership is broad or concentrated.
Read the workspace
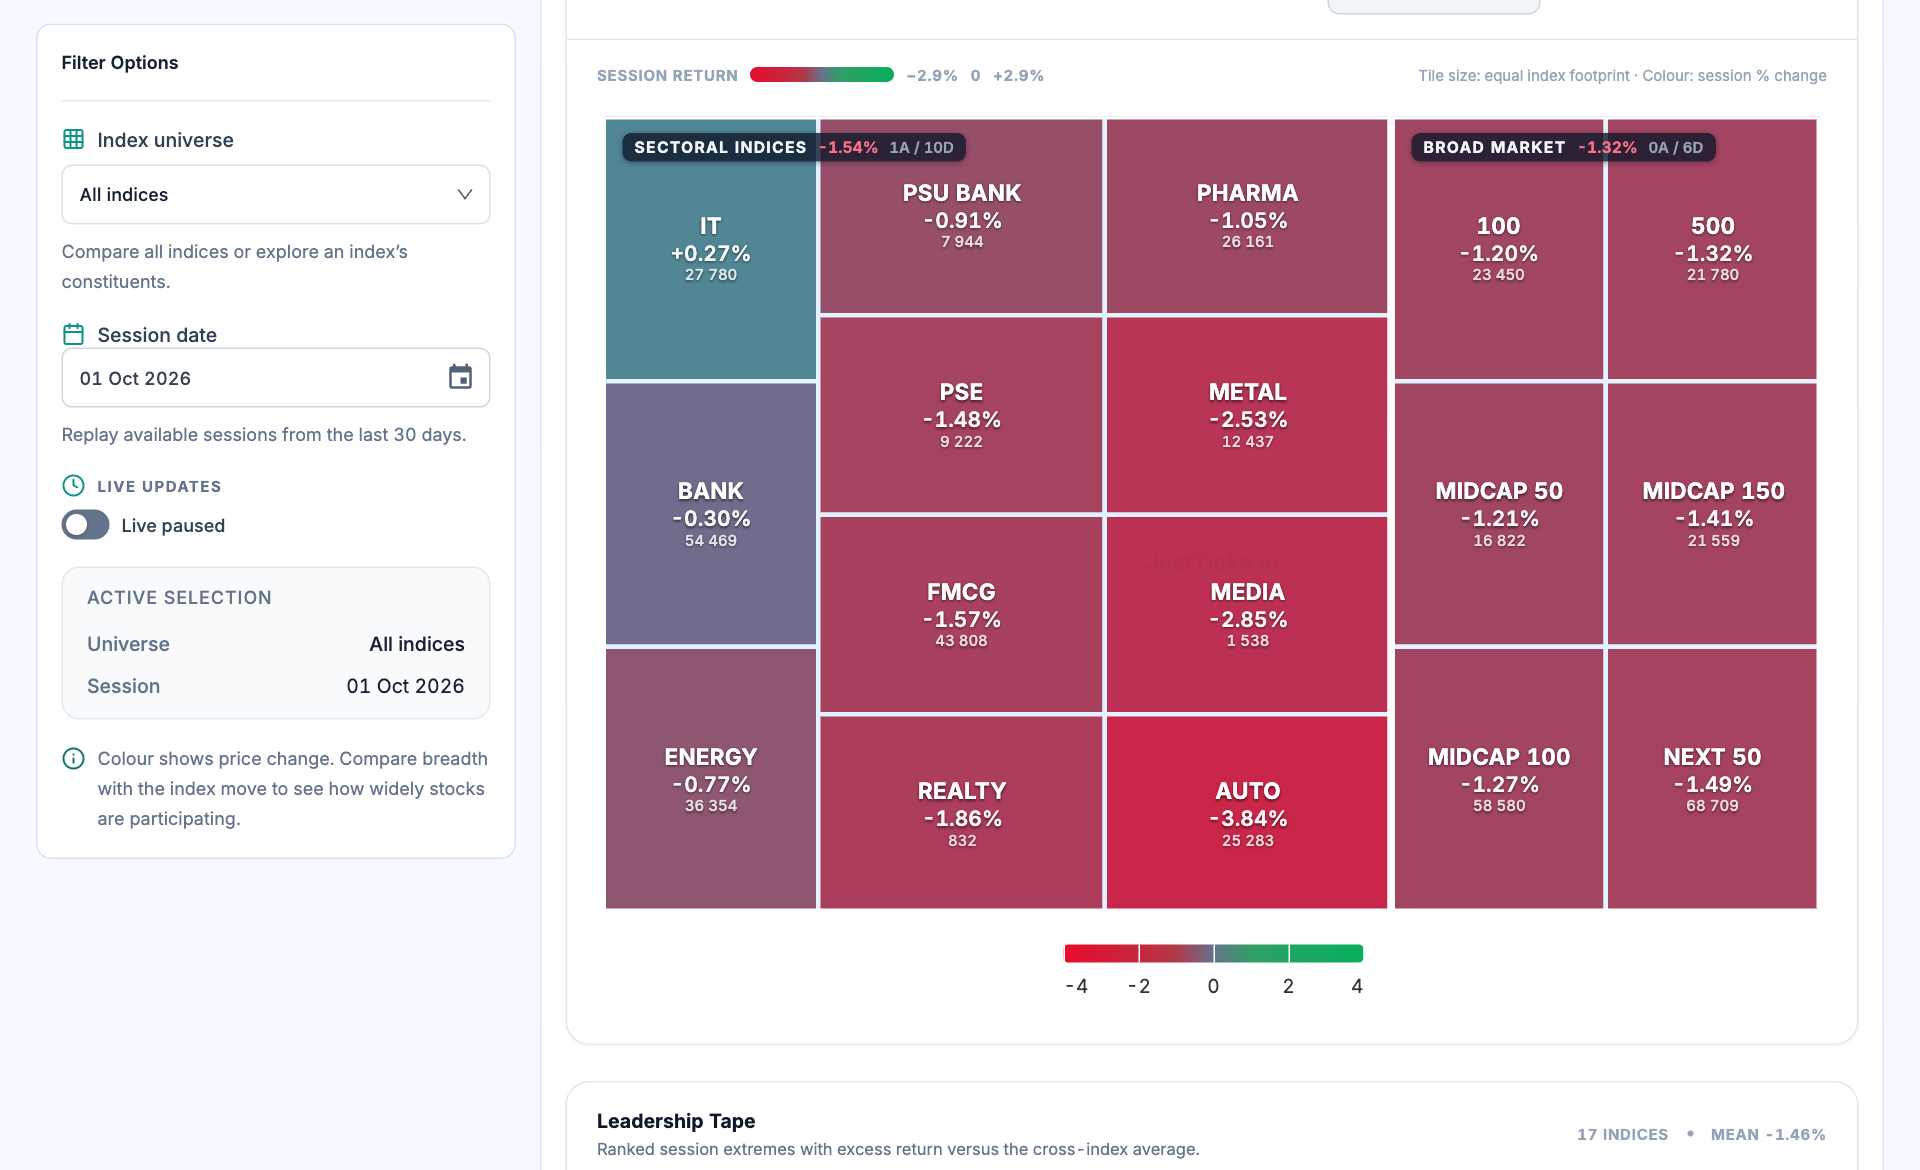
- Index universe. Choose all indices or an individual index before comparing the tiles.
- Session date. The selected session controls the historical snapshot. Confirm it before treating the map as current.
- Return tiles. Tile labels show the index level and session percentage change. This view uses an equal index footprint.
- Colour legend. Use the legend to judge magnitude. Colour indicates return, not turnover or money flow.
How to use Index heatmap
- Choose the index universe. Start with all indices for the market overview.
- Select the session date and check the live-update state.
- Compare the numerical returns of strong and weak sectors using the same session.
- Open the relevant constituent or contribution view to investigate the stocks behind the index move.
Understand the measurements
| Measurement | How to read it |
|---|---|
| Session return | Percentage change for the selected index and session. |
| Index level | The quoted index value, which is not comparable in absolute size across different indices. |
| Tile size | The all-index screenshot uses an equal index footprint; do not read tile area as market capitalisation. |
| Breadth | Advancing versus declining members supplies different information from the index return. |
A worked example
Suppose an IT index rises 0.3% while the broad market falls 1.2%. IT outperformed by 1.5 percentage points, but it is still necessary to check how many IT constituents advanced. Relative strength alone does not establish a future direction.
Worked example
This example explains the calculation or reading process. It is not a current market observation or a trade recommendation.
Checks before drawing a conclusion
- Compare dates and return baselines before comparing colours.
- A weighted index can be supported by a few large constituents.
- Sector and broad-market indices overlap, so tile counts are not independent stock counts.