
What this tool helps you investigate
Use this learning path to separate a broad futures scan from a single-contract timeline, a multi-session history or a participant report. The tools overlap in their inputs but answer different questions.
Each open futures contract has both a long and a short. Labels such as long buildup and short covering are conventional interpretations of price and OI changes rather than a count of unopposed buyers or sellers.
Choose a futures analysis workflow
| Your question | Guide | Useful distinction |
|---|---|---|
| Which contracts lead right now? | Futures dashboard | Cross-sectional price, OI and volume rankings |
| What does each contract row show? | Futures analysis | Detailed price, quantity, premium and activity columns |
| How did a contract change during the session? | Price versus OI | Levels and per-snapshot deltas on a timeline |
| How did interval classifications change? | Futures long-short | Interval table and chart workflow |
| What trend transitions occurred? | Futures trend | Historical and interval-based contract behaviour |
| Where are activity clusters? | Futures heatmap | Colour, size mode and sector grouping |
| Did the classification persist across days? | Buildup heatmap | Multi-session price-and-OI matrix |
| What was unusual? | Unusual futures activity | Deviation scores and time buckets |
| Do related contracts agree? | Sector continuation | Sector persistence and constituent confirmation |
| What does the daily exchange file show? | F&O bhavcopy | Daily and cumulative historical analysis |
| How do option quotes compare with futures? | Synthetic future | Matching options-derived quote versus actual futures |
| Which participant group holds exposure? | Participant OI | Long and short contracts by category |
Read the workspace
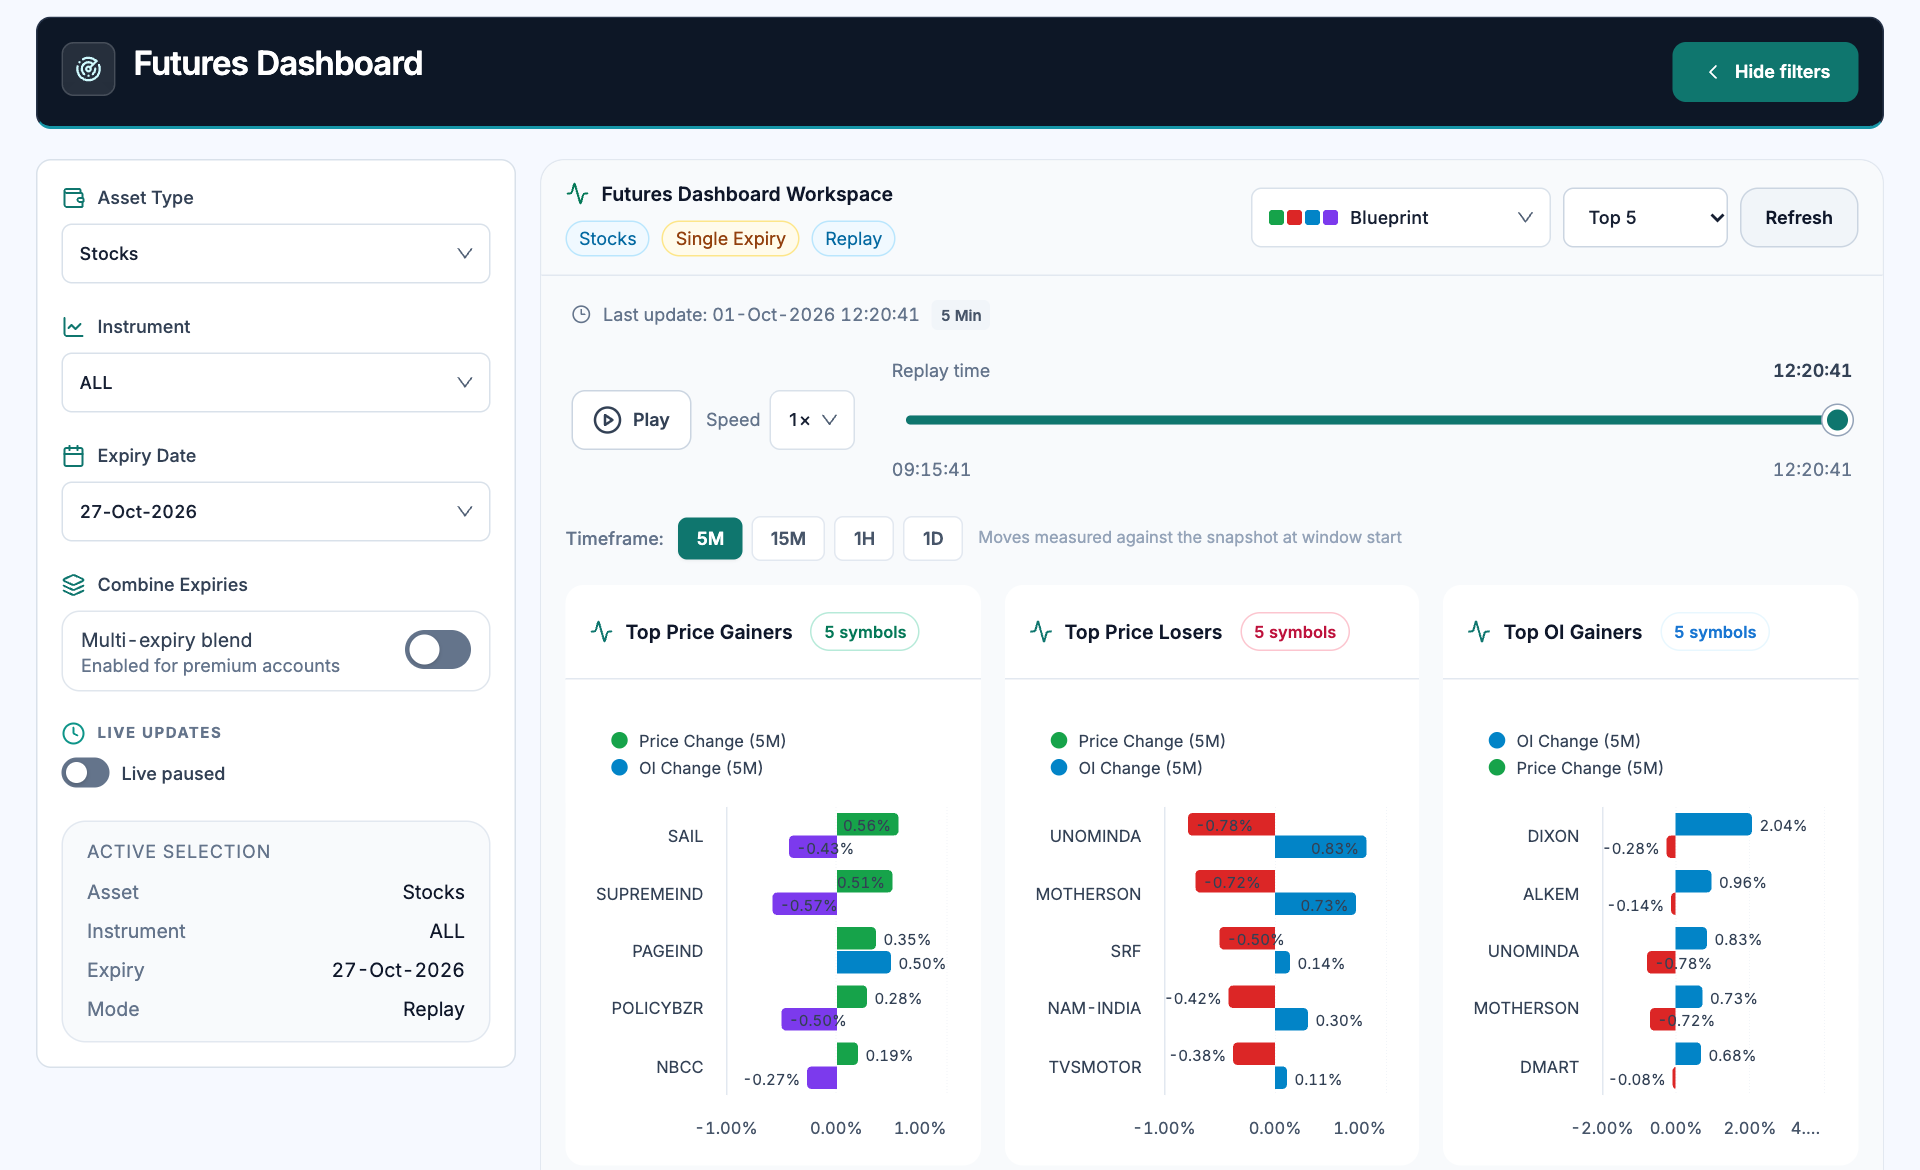
- Contract controls. Set the asset, instrument and expiry before ranking the covered futures.
- Replay timeline. The time slider selects a historical snapshot; check the displayed last-update time.
- Comparison interval. The selected interval changes the window-start reference for the moves.
- Leader panels. Price and OI leaders are separate rankings. The same contract can lead one list and lag another.
Review a contract consistently
- Choose the asset and exact expiry or confirm combined-expiry coverage.
- Read the source timestamp and price/OI comparison baseline.
- Compare price direction, OI change and volume over the same window.
- Inspect neighbouring observations or the historical matrix for persistence.
- Use participant data for category ownership and spot/futures comparisons for basis; neither comes directly from the buildup label.
OI, volume and the four price/OI descriptions
| Observation | Conventional description |
|---|---|
| Price up, OI up | Long buildup |
| Price down, OI up | Short buildup |
| Price up, OI down | Short covering |
| Price down, OI down | Long unwinding |
| OI level | Outstanding contract quantity |
| Volume | Quantity traded during the source period |
Near expiry, positions can move into a later series. A decline in the expiring contract does not establish that equivalent exposure disappeared across all expiries.
An example with matching baselines
Suppose futures price rises from 1,000 to 1,010 while OI rises from 1,00,000 to 1,05,000 contracts. Price is up 1% and OI is up 5% over that window. The conventional label is long buildup. If the next observation has higher price but lower OI, the latest interval can show covering even while the full-session OI change remains positive.
The arithmetic explains why a daily summary and an interval table can carry different labels without being inconsistent.
Checks before drawing a conclusion
- Use the same interval and expiry coverage across the panels.
- OI changes cannot identify the trader or hedge behind a position.
- Near-expiry migration can dominate the selected-series OI change.