
Scan families
| Family | Example scans | Finds |
|---|---|---|
| Momentum | RSI overbought, RSI oversold | Stocks with extreme or rising strength |
| Trend | Golden cross, price above moving averages | Established or newly turning trends |
| Breakout | 52-week high break, range break | Stocks clearing key levels |
| Volume | High delivery %, volume surge | Stocks with unusual participation |
| Intraday | VWAP reclaim | Same-session setups |
| Candlestick | Engulfing patterns | Reversal or continuation candles |
Screenshot: controls and readings
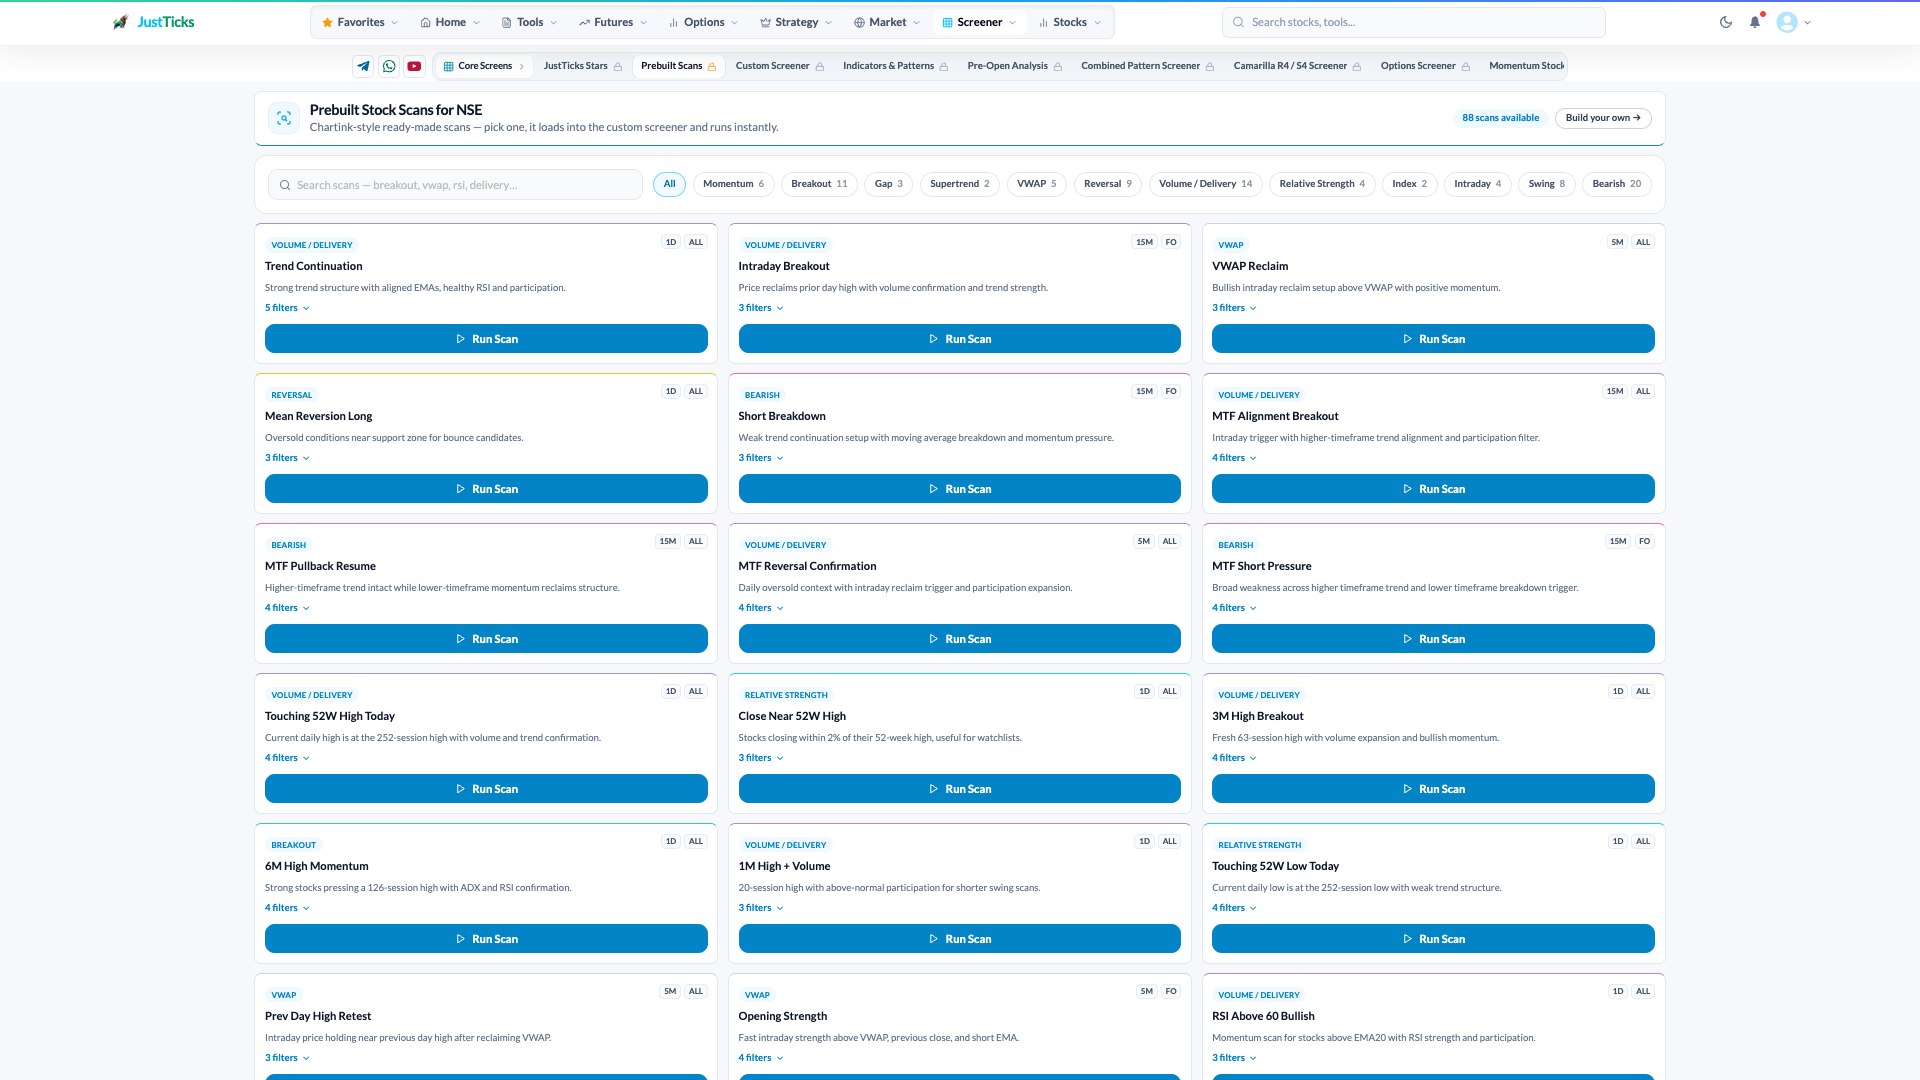
- Scan families. Choose a family that matches the question rather than selecting from the whole catalogue at random.
- Scan definition. The card states the condition and the number of filters. Review these before running it.
- Interval and segment. A daily cash-market scan and an intraday F&O scan cover different observations.
- Run the chosen scan. Open the preset, inspect its conditions and then review the resulting stocks.
How to use the Prebuilt Scans
- Open Prebuilt Scans and search for a setup or choose its category.
- Expand a scan to read the actual conditions and timeframe.
- Run the scan, then check that each result meets the conditions at the shown timestamp.
- Compare another scan only after noting whether it uses daily or intraday observations.
- Use the Technical Screener when you need a custom rule instead of a preset.
Choosing a scan for your style
- Intraday traders: VWAP, opening-range and volume-surge scans on 5m and 15m data.
- Swing traders: breakout, trend and pullback scans on daily data, refreshed after the close.
- Positional investors: relative strength, new-high and delivery-based scans.
Start with two or three scans you understand, instead of running every one. A scan is useful only when you know what a typical result looks like.
A worked example
A swing trader's weekly routine on daily data after the close:
- Run three scans they understand: 52-week high break, golden cross and high delivery percentage.
- Note which stocks appear in two scans, since they have independent reasons to be there.
- Open each chart and check the base, volume and nearest resistance.
- Keep the two or three cleanest on a watchlist with entry, stop and size written down.
The scan narrows hundreds of stocks to a handful. The chart review and the plan do the rest.
Worked example
Illustrative numbers for a hypothetical stock, not a recommendation or a past trade.
Validate every result
- Open the chart and confirm the condition is visible.
- Check liquidity: average volume and spread.
- Look for the nearest support and resistance.
- Check the index and the sector for context.
- Define the entry, stop and size before acting.
Note
Scans are filters, not recommendations. A stock appearing on a scan means it met a condition, not that it should be bought or sold.