
What this tool helps you investigate
Use the commodity heatmap to compare returns of covered metal and energy contracts across several horizons. It gives cross-asset context before inspecting a particular contract.
Commodity contracts differ in expiry, lot size, quote units and session timing. Percentage returns make direction easier to compare, but they do not make the exposures interchangeable.
Read the workspace
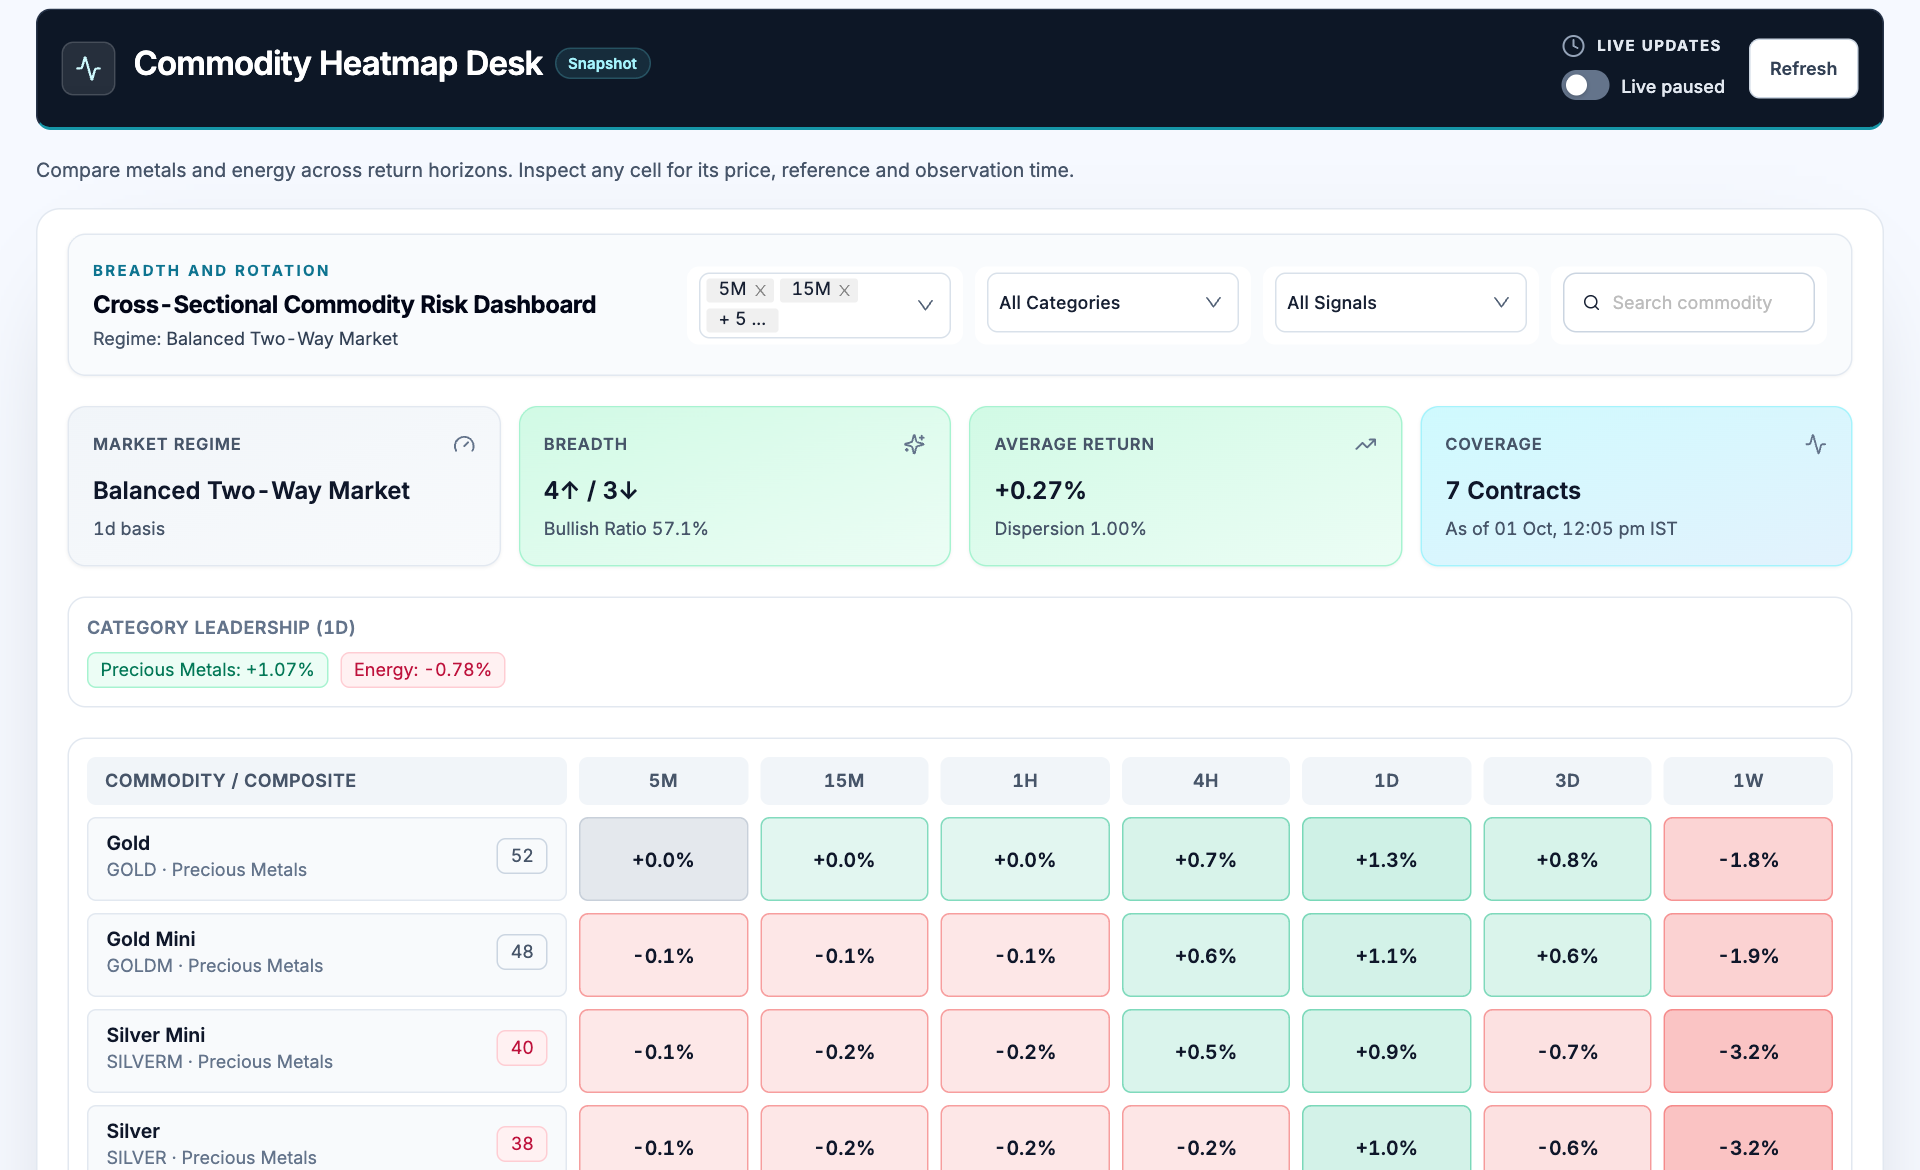
- Comparison filters. Choose horizons and commodity categories to keep the comparison relevant.
- Breadth summary. The count uses the covered contracts in the snapshot; related gold contracts can appear as separate entries.
- Coverage timestamp. Check contract count and source time before interpreting a colour.
- Horizon matrix. A daily gain can sit beside a weekly loss. Read across the row rather than selecting one green cell.
How to use Commodity heatmap
- Select horizons and the relevant category such as precious metals or energy.
- Read the coverage timestamp and any unavailable observations.
- Compare each contract across daily and shorter horizons to identify agreement or divergence.
- Open the underlying contract workspace and confirm expiry, quote unit and liquidity.
Understand the measurements
| Measurement | How to read it |
|---|---|
| Return | Percentage price change over the labelled horizon. |
| Category leadership | Relative performance summary for the covered group. |
| Breadth | Positive versus negative contracts in the covered snapshot. |
| Coverage | The contract count and observation time, which limit the scope of the comparison. |
A worked example
Gold showing +1.3% for one day and -1.8% for one week is a daily rebound inside a weaker week. If Gold Mini behaves similarly, that is related-contract agreement rather than two independent asset classes confirming a trend.
Worked example
This example explains the calculation or reading process. It is not a current market observation or a trade recommendation.
Checks before drawing a conclusion
- Compare matching horizons and source timestamps.
- Different contract expiries and quote units can produce different returns.
- Covered-contract breadth does not describe the whole global commodity market.