
What this tool helps you investigate
Use the futures trend view to study how contract price and OI behaviour changes through a selected observation window or historical session. It is useful for reviewing transitions rather than viewing only a final daily label.
The comparison baseline matters: a contract can show a negative daily price change and a positive latest-interval price change at the same time. Record the interval before describing a transition.
Read the workspace
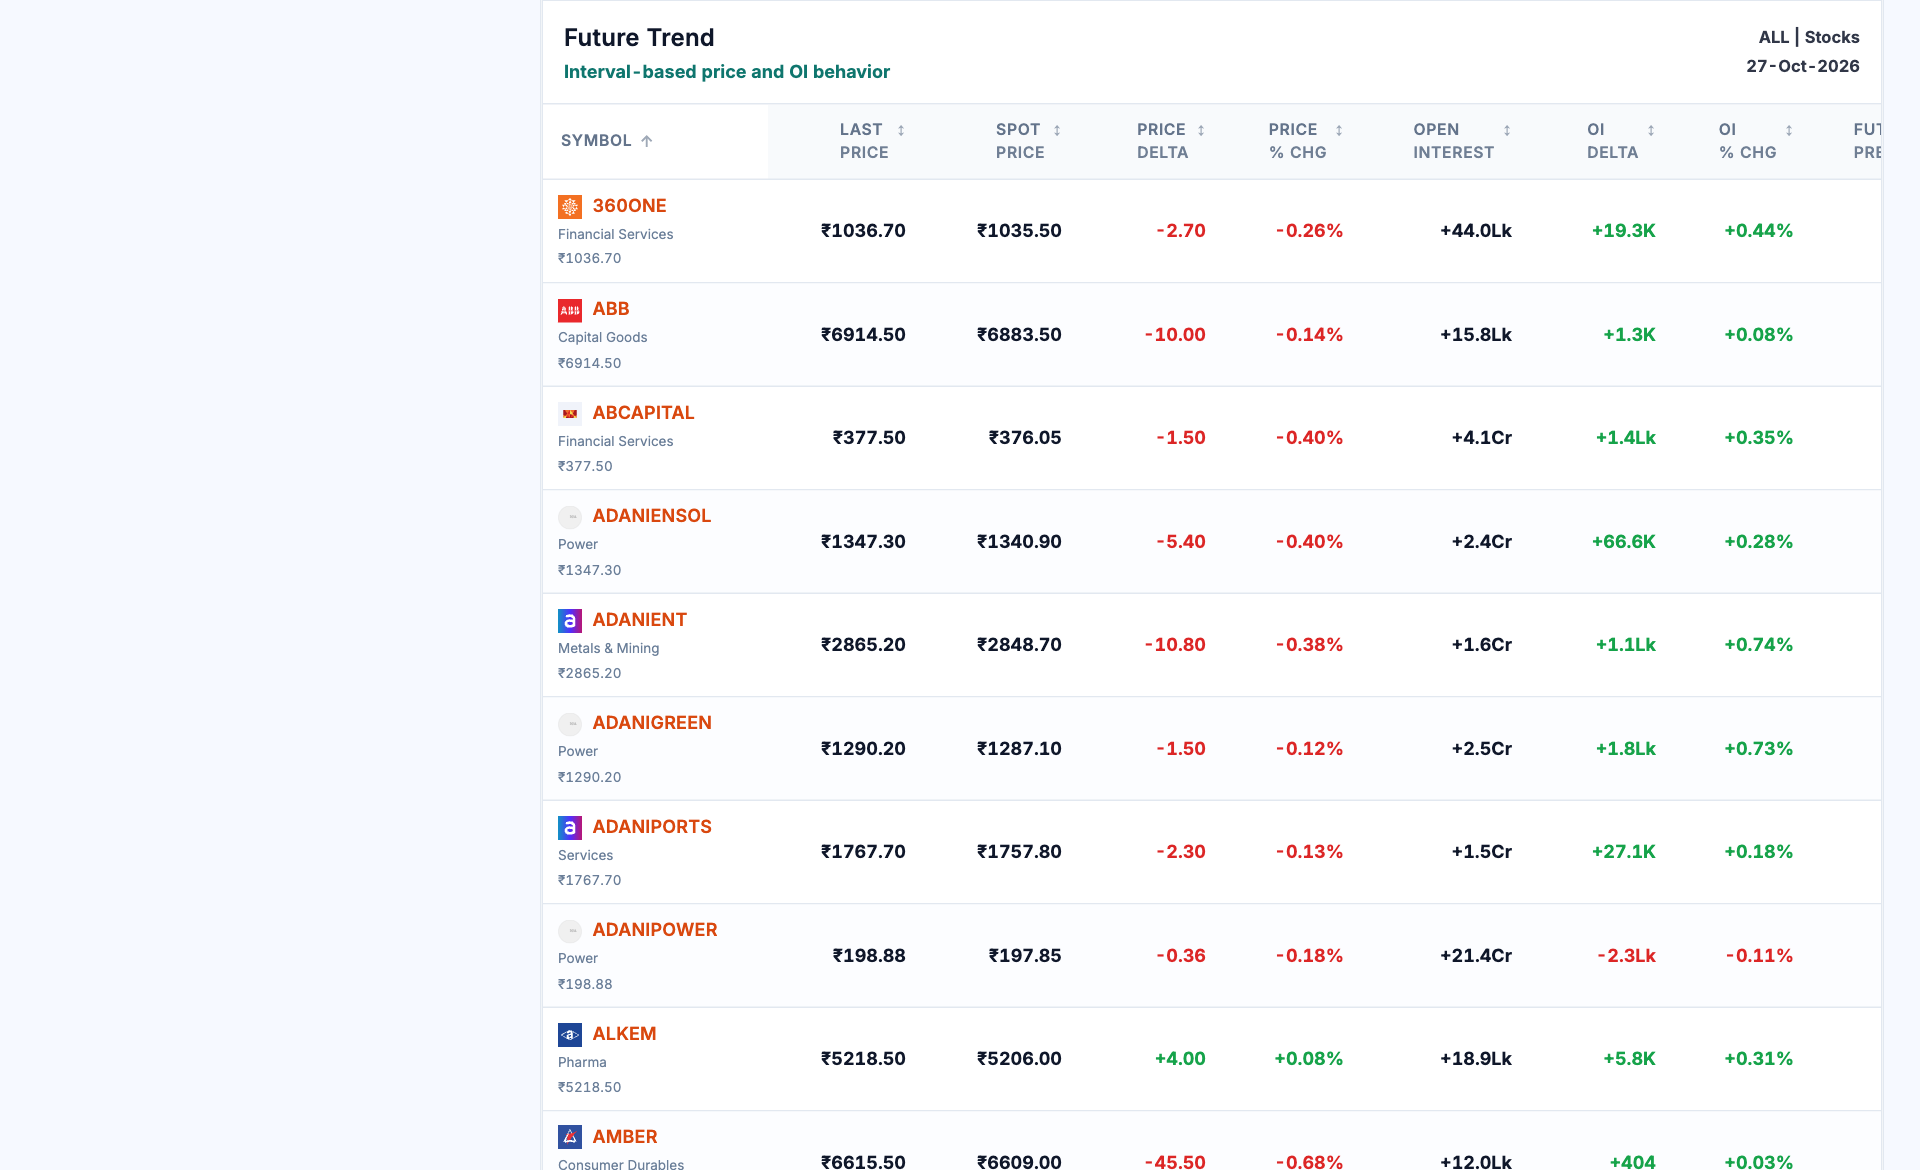
- Trend table. The heading identifies interval-based price and OI behaviour rather than a standalone price forecast.
- Expiry. Read the selected contract expiry before comparing positioning over time.
- Futures versus spot. Separate the last futures quote from the spot quote and read their timing.
- OI movement. Compare total OI with its delta and percentage change over the selected interval.
How to use Futures trend
- Choose the asset, instrument and expiry.
- Select the live or historical date and the comparison interval available in the workspace.
- Read futures price and OI changes over that same interval.
- Compare consecutive observations to see whether expansion, contraction or direction persists.
Understand the measurements
| Measurement | How to read it |
|---|---|
| Last futures price | The sampled contract quote. |
| Spot price | The underlying quote, which may have a different source timestamp. |
| Price delta | Price movement over the selected comparison interval. |
| OI delta | Change in outstanding quantity over the matching positioning interval. |
A worked example
A contract can fall during the morning with OI rising, then recover in the next interval as OI falls. That is a transition from price weakness with expansion to a rebound with contraction. A single end-of-day label would miss the change in behaviour.
This example explains the calculation or reading process. It is not a current market observation or a trade recommendation.
Checks before drawing a conclusion
- Read the observation interval and historical date before interpreting a transition.
- Different quote timestamps can distort small futures-versus-spot differences.
- Repeating a label does not establish that the same traders retained their positions.