
What this tool helps you investigate
Use this heatmap to compare futures price-and-OI classifications over several sessions. It is designed to reveal persistence and transitions that a one-session screener does not show.
The four labels describe combinations of price and OI change. Every outstanding futures contract has both a long and a short; the labels do not reveal gross buyers or sellers independently.
Read the workspace
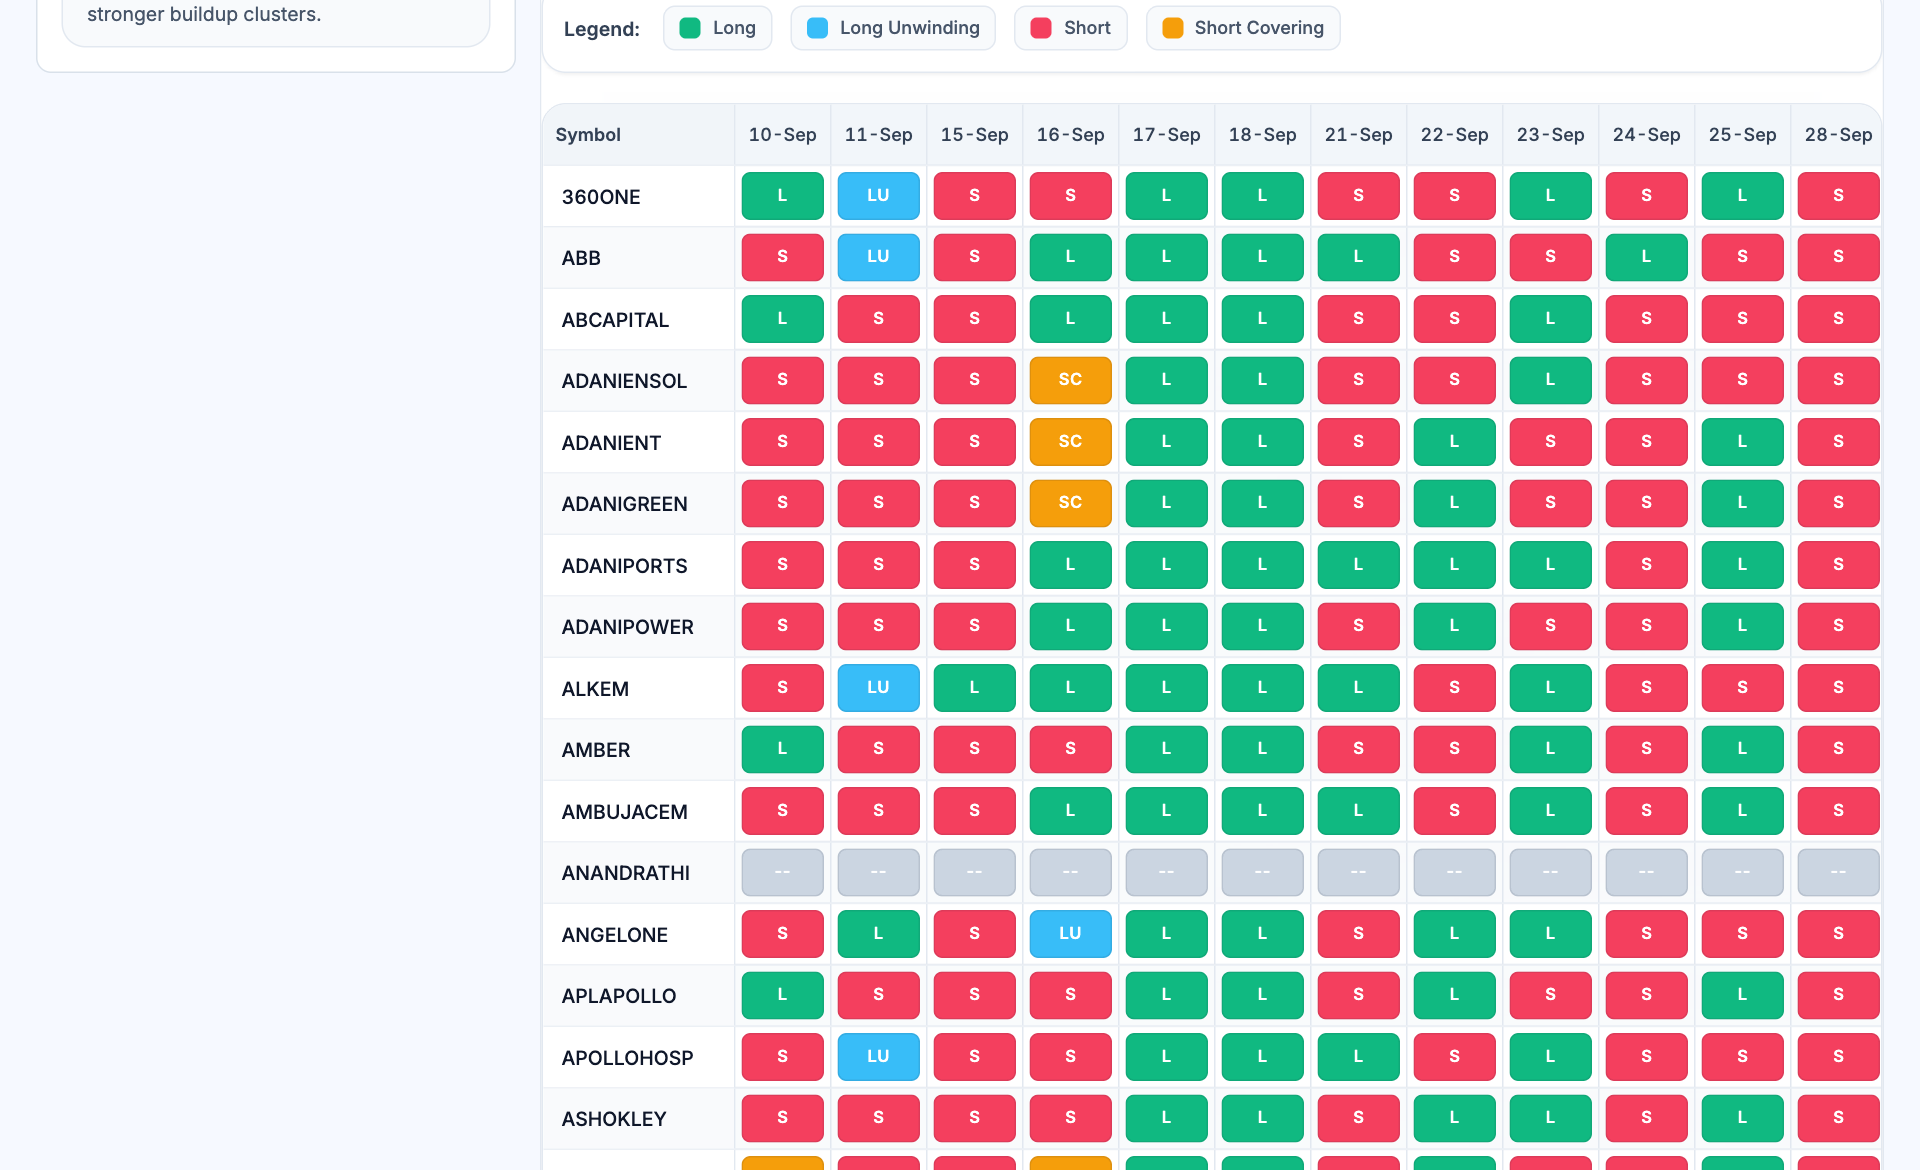
- Classification legend. Long, long unwinding, short and short covering use distinct colours and abbreviations.
- Date columns. Each column refers to a separate session; read chronology before interpreting a run.
- Contract row. Read across one symbol to study changes in its classification.
- Unavailable observations. A grey dash is missing or unavailable classification, not a neutral market position.
How to use Futures buildup heatmap
- Choose the asset, expiry and available lookback.
- Read the legend and note how missing observations appear.
- Follow one symbol across dates to inspect repeated classifications and reversals.
- Compare the pattern with price levels, volume and expiry migration in a detailed contract view.
Understand the measurements
| Measurement | How to read it |
|---|---|
| L | Price up with OI up: conventionally called long buildup. |
| S | Price down with OI up: conventionally called short buildup. |
| SC | Price up with OI down: conventionally called short covering. |
| LU | Price down with OI down: conventionally called long unwinding. |
A worked example
A sequence L, L, SC shows two price-rise sessions with OI expansion followed by a price-rise session with OI contraction. Price rose on all three observations, but the positioning behaviour changed on the final one.
Worked example
This example explains the calculation or reading process. It is not a current market observation or a trade recommendation.
Checks before drawing a conclusion
- Check the contract and session coverage before counting repeated labels.
- A missing cell must not be counted as no change.
- Expiry rolls can change OI independently of a directional view.