
What this tool helps you investigate
Use the futures heatmap to locate clusters of activity across the selected contract universe. Sector grouping makes it easier to see whether strength is widespread or isolated.
Colour and tile area encode different inputs. The screenshot shows a size-mode switch, so a large tile cannot be interpreted until the active sizing mode and colour metric are known.
Read the workspace
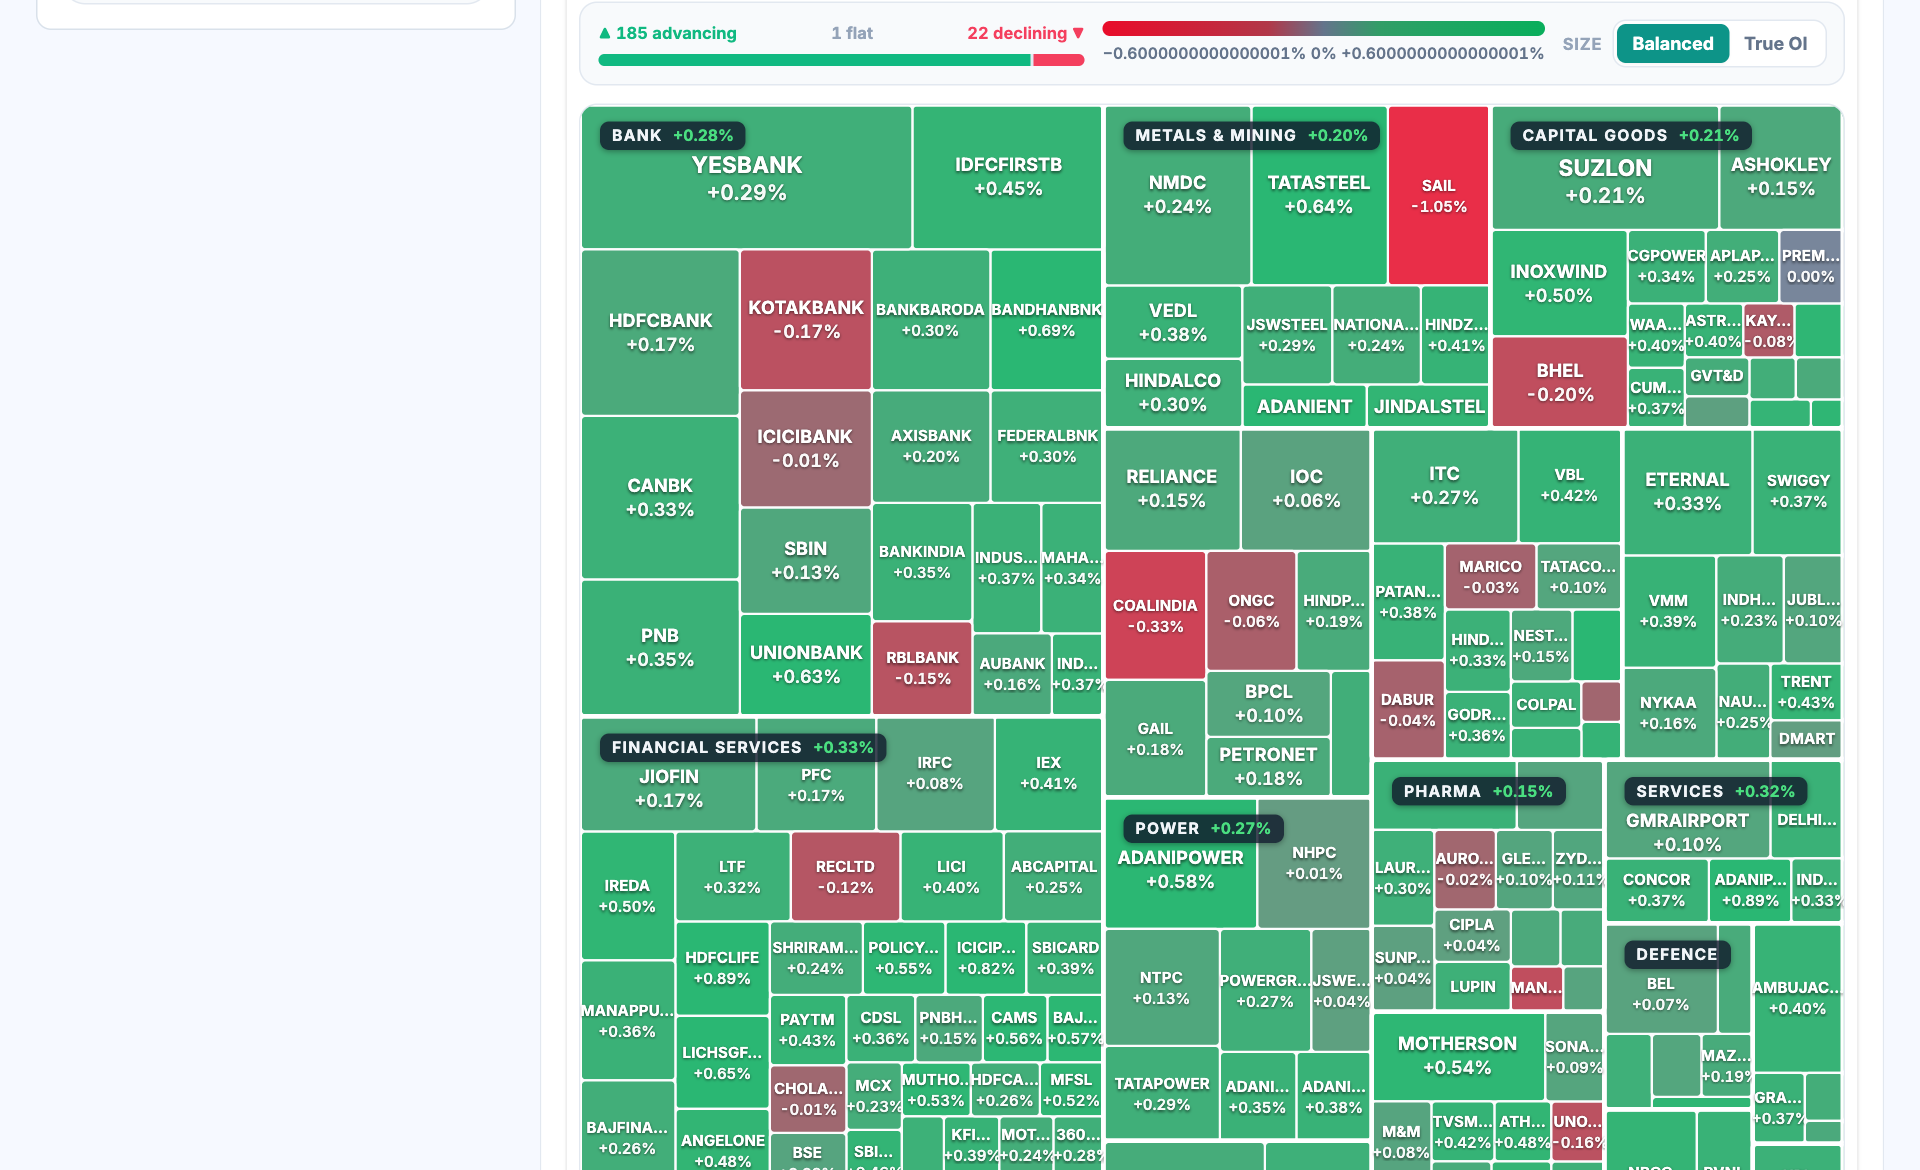
- Advancing and declining counts. Breadth describes the selected futures universe at the observed snapshot.
- Tile sizing mode. Balanced and True OI use different size treatments. Check the active mode before comparing areas.
- Contract tile. Read the contract label and percentage value, not just its colour.
- Sector grouping. Sector headers help identify agreement among related contracts.
How to use Futures heatmap
- Choose the asset universe, contract expiry and comparison period.
- Confirm the colour metric and the tile-sizing mode.
- Compare breadth with sector-level clusters.
- Open an outlier contract in futures analysis or a price-and-OI timeline.
Understand the measurements
| Measurement | How to read it |
|---|---|
| Colour | Direction and magnitude of the selected change metric. |
| Balanced sizing | A size presentation intended to preserve visibility of smaller entries. |
| True OI sizing | Tile area follows outstanding OI more directly. |
| Sector breadth | The distribution of positive and negative contract changes inside a group. |
A worked example
If most banking tiles are green while one large bank is red, the sector picture contains both broad positive participation and a notable exception. Switching size mode can make the exception more prominent without changing its underlying return.
Worked example
This example explains the calculation or reading process. It is not a current market observation or a trade recommendation.
Checks before drawing a conclusion
- Read the selected metric, expiry and size mode before interpreting area or colour.
- Contract quantities and lot sizes can differ across stocks and commodities.
- A broad green map is an observed snapshot, not a prediction of continuation.