
What this tool helps you investigate
Use the futures dashboard for a cross-sectional overview of price, open-interest and volume activity over the same selected interval. It helps choose which contracts deserve a closer timeline review.
A price leader need not be an OI leader. Comparing the secondary bar in each panel reveals whether the price move coincided with position expansion or contraction.
Read the workspace
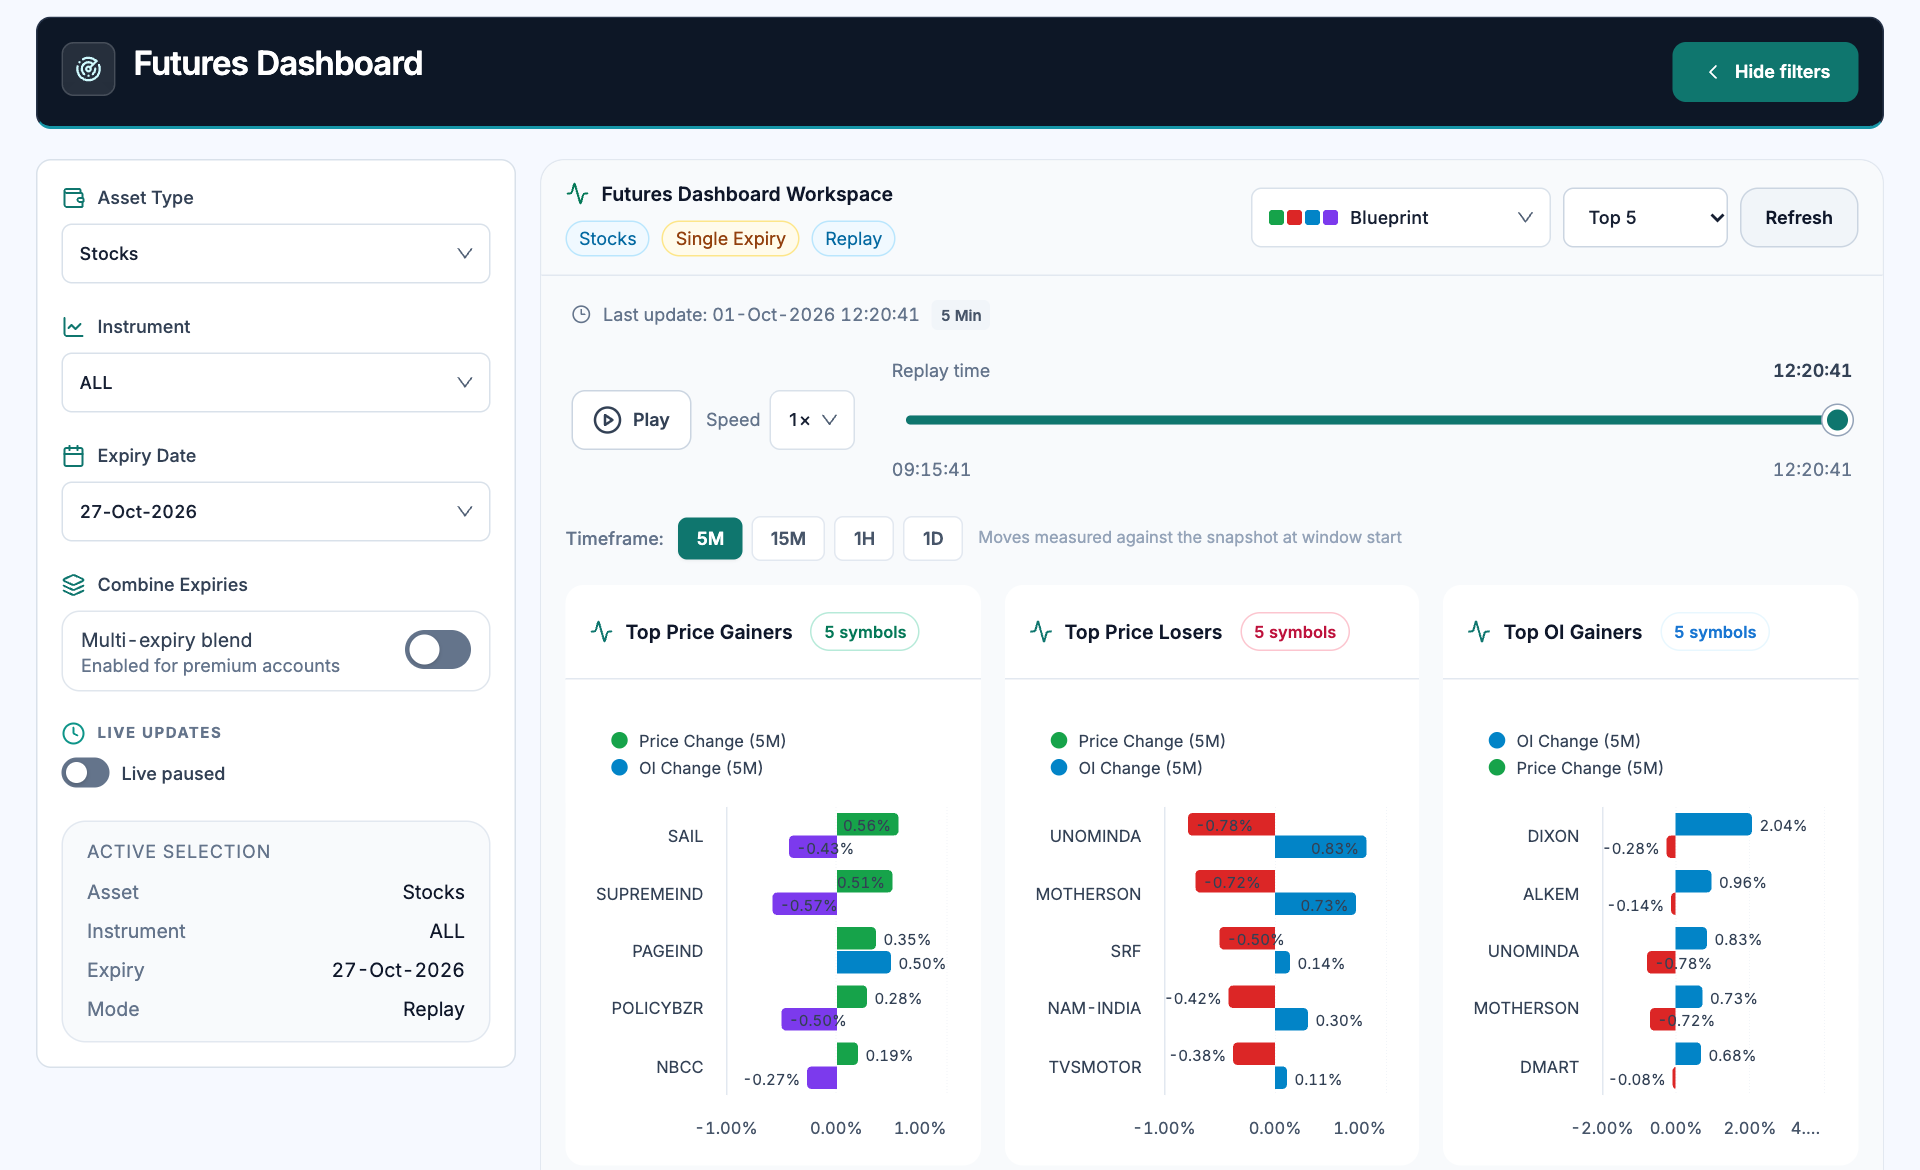
- Contract controls. Set the asset, instrument and expiry before ranking the covered futures.
- Replay timeline. The time slider selects a historical snapshot; check the displayed last-update time.
- Comparison interval. The selected interval changes the window-start reference for the moves.
- Leader panels. Price and OI leaders are separate rankings. The same contract can lead one list and lag another.
How to use Futures dashboard
- Choose the asset type, instrument set and expiry.
- Set single-expiry or combined-expiry coverage where available.
- Choose the comparison interval and, in replay mode, the observation time.
- Compare price and OI leader panels, then inspect a contract in price-versus-OI or the trend view.
Understand the measurements
| Measurement | How to read it |
|---|---|
| Price change | Move from the dashboard window-start reference to the selected snapshot. |
| OI change | Position quantity change over the same comparison window. |
| Top N | The number of ranked contracts shown; it does not change the underlying market universe. |
| Combined expiries | A wider coverage mode that should not be compared casually with a single series. |
A worked example
A contract with price +0.6% and OI -0.4% can top the price-gainer panel while position quantity shrinks. The usual description is a price rise with covering or contraction, which differs from a price rise accompanied by expanding OI.
Worked example
This example explains the calculation or reading process. It is not a current market observation or a trade recommendation.
Checks before drawing a conclusion
- Use the same interval and expiry coverage across the panels.
- OI changes cannot identify the trader or hedge behind a position.
- Near-expiry migration can dominate the selected-series OI change.