
What this tool helps you investigate
Use futures analysis to inspect contract-level price, open interest, traded volume and premium in a sortable table. It is a detailed inventory rather than the dashboard top-mover summary.
Read absolute OI changes with their percentage and starting base. A large raw quantity can be ordinary for one contract but exceptional for another.
Read the workspace
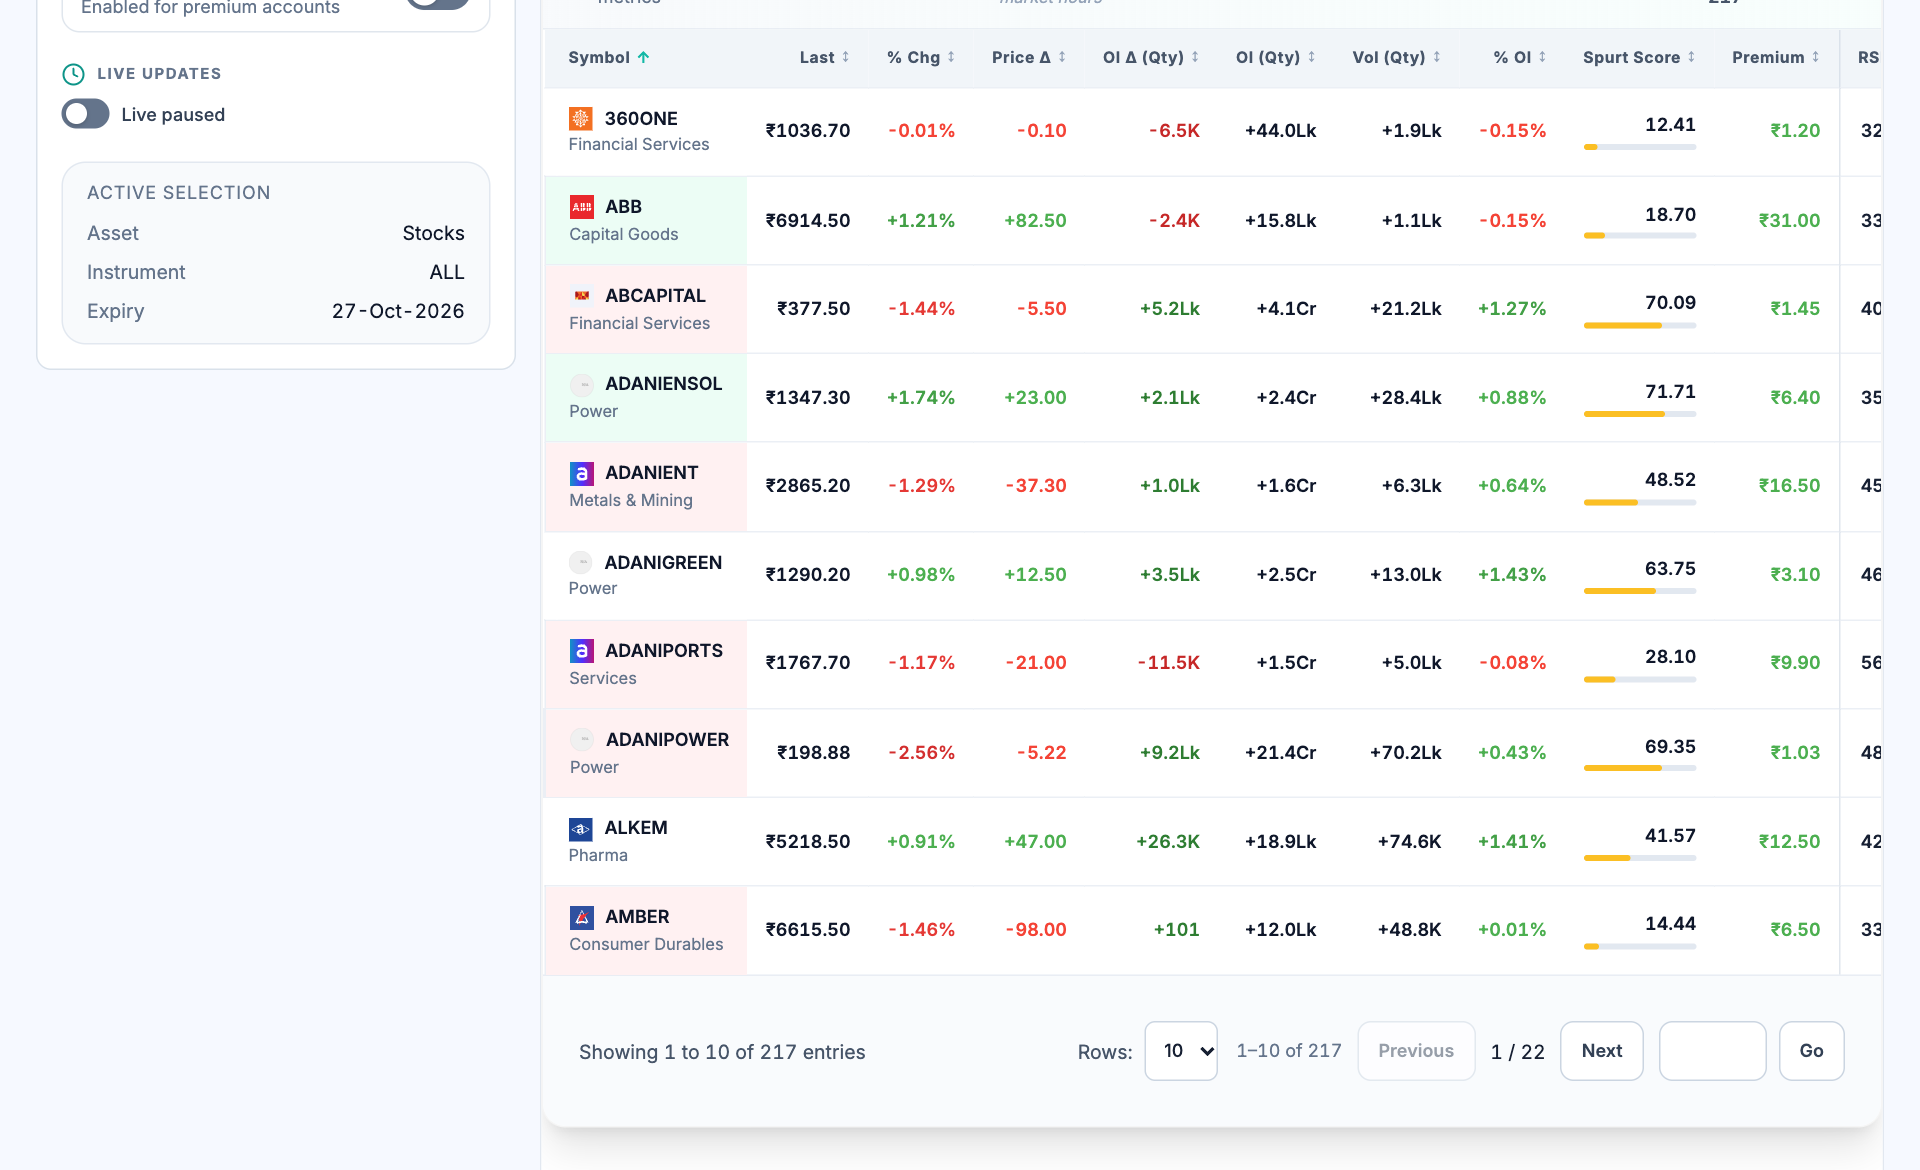
- Active contract selection. The left summary records the selected asset, instrument and expiry.
- Price columns. Last price, percentage change and price delta are related but use different units.
- Position and activity. OI delta, total OI and traded volume measure different aspects of the contract.
- Premium and score. Premium is a price comparison; the spurt score is a model rank rather than a forecast.
How to use Futures analysis
- Choose asset type, instrument and expiry coverage.
- Confirm the observation time or historical session.
- Sort a column that matches the question, such as OI expansion or price movement.
- Read the complete row before opening a timeline or chart for that contract.
Understand the measurements
| Measurement | How to read it |
|---|---|
| Last and price delta | Latest sampled futures price and change from the stated baseline. |
| OI and OI delta | Outstanding quantity and its change; this is different from volume traded. |
| Volume | Turnover in quantity over the source period, not outstanding positions. |
| Premium | Futures-versus-spot difference affected by carry, dividends and quote timing. |
A worked example
If futures move from 1,000 to 1,010 while OI rises from 10 lakh to 10.5 lakh, price is up 1% and OI is up 5%. That combination is usually labelled long buildup; the table alone cannot identify whether the positions belong to outright or hedged strategies.
Worked example
This example explains the calculation or reading process. It is not a current market observation or a trade recommendation.
Checks before drawing a conclusion
- Check the exact price and OI reference before comparing rows.
- Quantity-based comparisons need contract and lot-size context.
- A premium is not automatically a directional signal or an executable arbitrage.