
What this tool helps you investigate
Use unusual futures activity to find observations that differ from the recent behaviour of the contract or comparison group. Then investigate the underlying price, volume and OI evidence.
A session overview and a selected time bucket can report different breadth because they answer different questions. High unusualness means an observation deserves inspection; it does not imply a favourable trade.
Read the workspace
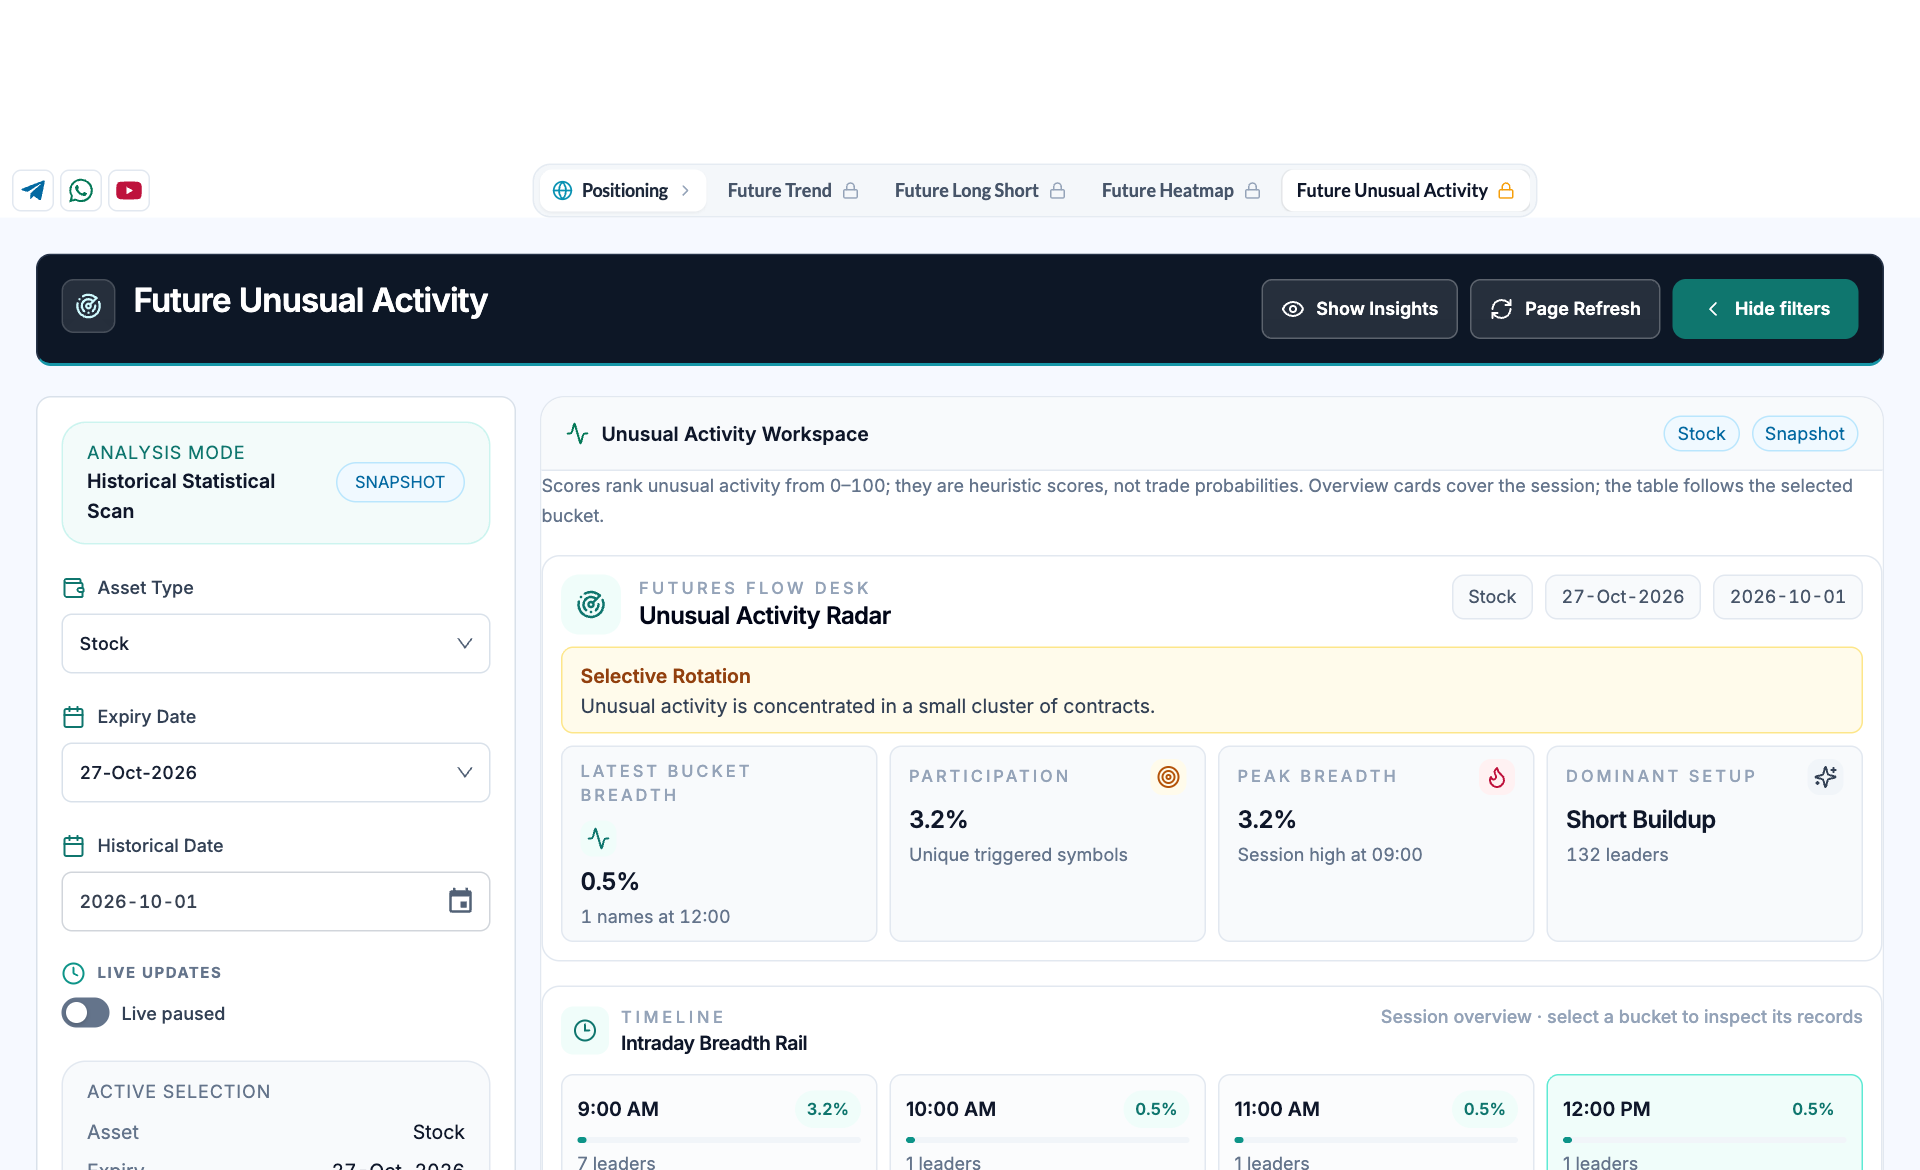
- Contract and session. Choose asset, expiry and historical date before reading the scan.
- Score definition. The workspace states that unusualness scores are heuristic rankings, not trade probabilities.
- Participation summary. Unique session participation differs from the latest bucket breadth.
- Time-bucket rail. Select a bucket to inspect its records; overview cards and selected-bucket results can cover different scopes.
How to use Unusual futures activity
- Select the asset, expiry and observation date.
- Read the session summary and the score definition.
- Choose a time bucket and inspect the records associated with it.
- Compare an event with its contract history, liquidity and any contemporaneous catalyst.
Understand the measurements
| Measurement | How to read it |
|---|---|
| Unusualness score | A heuristic rank of deviation in the model inputs. |
| Latest bucket breadth | Share of the covered universe triggered in the selected/latest time bucket. |
| Participation | Unique triggered symbols over the session scope used by the summary. |
| Dominant setup | The most prevalent price-and-OI classification among the relevant observations. |
A worked example
A session may have 3.2% unique participation while the latest bucket has only 0.5% breadth. That means some earlier events are no longer triggering in the latest window; it does not make either number incorrect.
Worked example
This example explains the calculation or reading process. It is not a current market observation or a trade recommendation.
Checks before drawing a conclusion
- Match the session-summary scope with the selected bucket before comparing counts.
- Anomalies can reflect news, low baselines, illiquidity or rollover.
- Scores are rankings and should not be presented as success probabilities.