
What this tool helps you investigate
Use price versus OI to examine one futures contract over time. The level chart shows the broader structure while snapshot deltas isolate the change between consecutive observations.
Price and OI have different units and separate axes. A visual crossing of the two lines has no standalone mathematical meaning; direction and change over matched timestamps matter.
Read the workspace
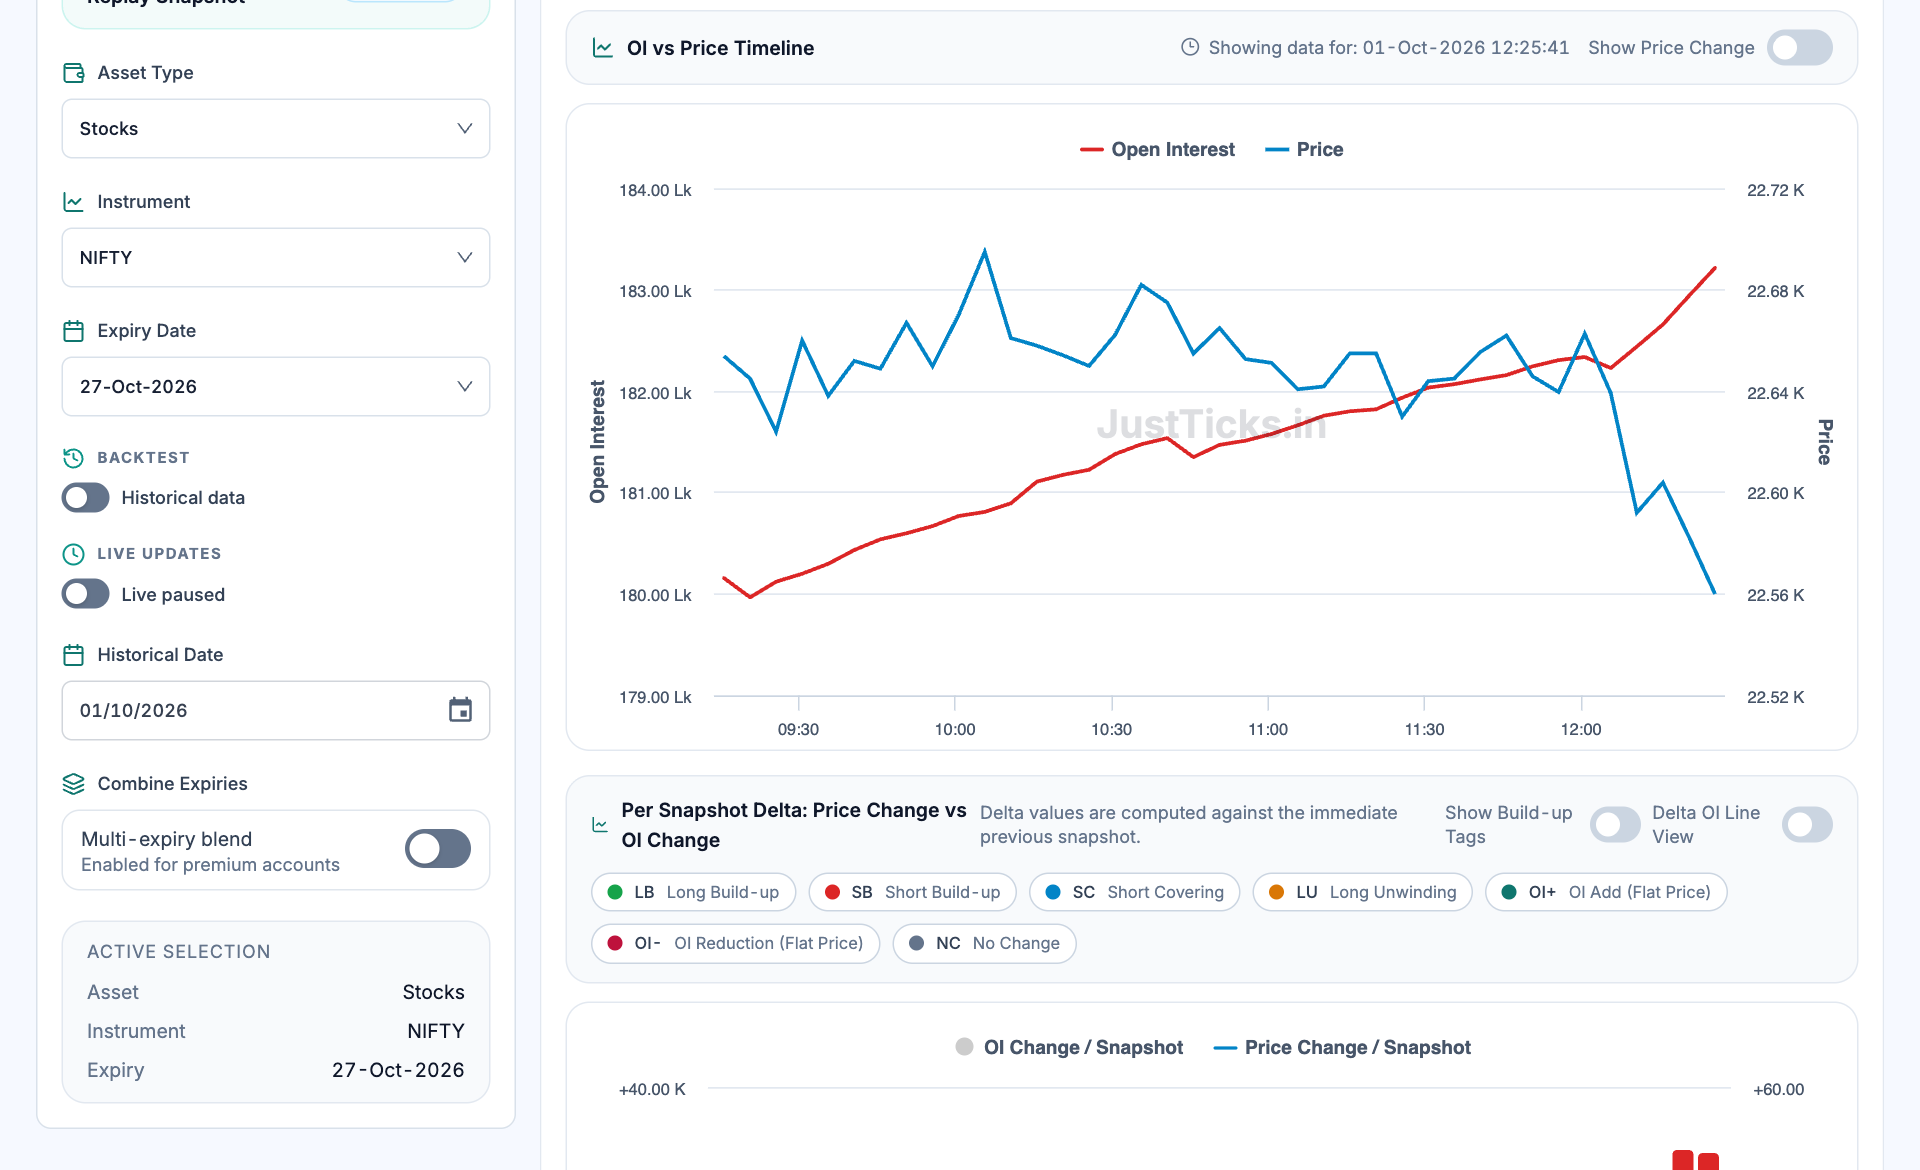
- Instrument and expiry. Keep the selected contract fixed when reviewing a timeline.
- Two chart scales. Price and OI use separate axes. A line crossing is not a numerical crossover between comparable values.
- Snapshot baseline. The lower panel states that deltas use the immediately previous snapshot.
- Buildup legend. Use the legend to distinguish expansion, contraction and flat-price cases.
How to use Price versus open interest
- Select the asset, instrument and expiry, then choose live or a historical session.
- Read the latest source timestamp before inspecting the level chart.
- Compare the direction of price and OI over the same segment.
- Use the per-snapshot delta panel and optional buildup tags to inspect changes within that segment.
Understand the measurements
| Measurement | How to read it |
|---|---|
| Price level | The futures quote at each sampled observation. |
| OI level | Outstanding position quantity at the observation. |
| Per-snapshot delta | Current observation minus the immediately preceding sampled observation. |
| Buildup label | A convention based on the signs of the matched price and OI changes. |
A worked example
Suppose price falls from 1,010 to 1,000 while OI rises from 10 lakh to 10.2 lakh between two snapshots. The interval has price weakness and 2% OI expansion, conventionally labelled short buildup. This says nothing by itself about the net position of a named participant.
This example explains the calculation or reading process. It is not a current market observation or a trade recommendation.
Checks before drawing a conclusion
- Compare matching timestamps and read each axis unit.
- A line intersection is not a buy or sell condition.
- Combined expiries, rollover and missing samples can change the interpretation.