
What the bhavcopy contains
The bhavcopy lists each futures and options contract that traded in the session: open, high, low and close, settlement price, contracts traded, traded value, open interest and the change in open interest. NSE publishes it once per trading day after the close, so it reflects final end-of-day figures, not live ticks.
The four buildup classes
| Price | Open interest | Class | Meaning |
|---|---|---|---|
| Up | Up | Long buildup | Price rise with outstanding positions expanding |
| Down | Up | Short buildup | Price decline with outstanding positions expanding |
| Up | Down | Short covering | Price rise with outstanding positions contracting |
| Down | Down | Long unwinding | Price decline with outstanding positions contracting |
These are conventional descriptions of the joint price and OI change. Every futures contract has a long and a short; the quadrant alone does not identify participants or distinguish a hedge from a directional position.
Daily versus cumulative change
Daily OI change compares each day with the previous close and shows that session's flow. Cumulative OI change measures the shift from the start of your chosen window, showing the standing position built or unwound across several days. A stock with small daily changes but a large cumulative build is accumulating quietly.
Basis and relative strength
- Basis is the futures price minus the spot price. A widening premium can indicate bullish positioning; a discount can indicate bearish positioning, though cost of carry and dividends affect it.
- Relative strength versus NIFTY shows whether a stock's derivatives move is stronger than the index's.
- Rollover near expiry shifts OI between contracts, so compare like-for-like contracts.
How to use the FO Bhavcopy Analyser
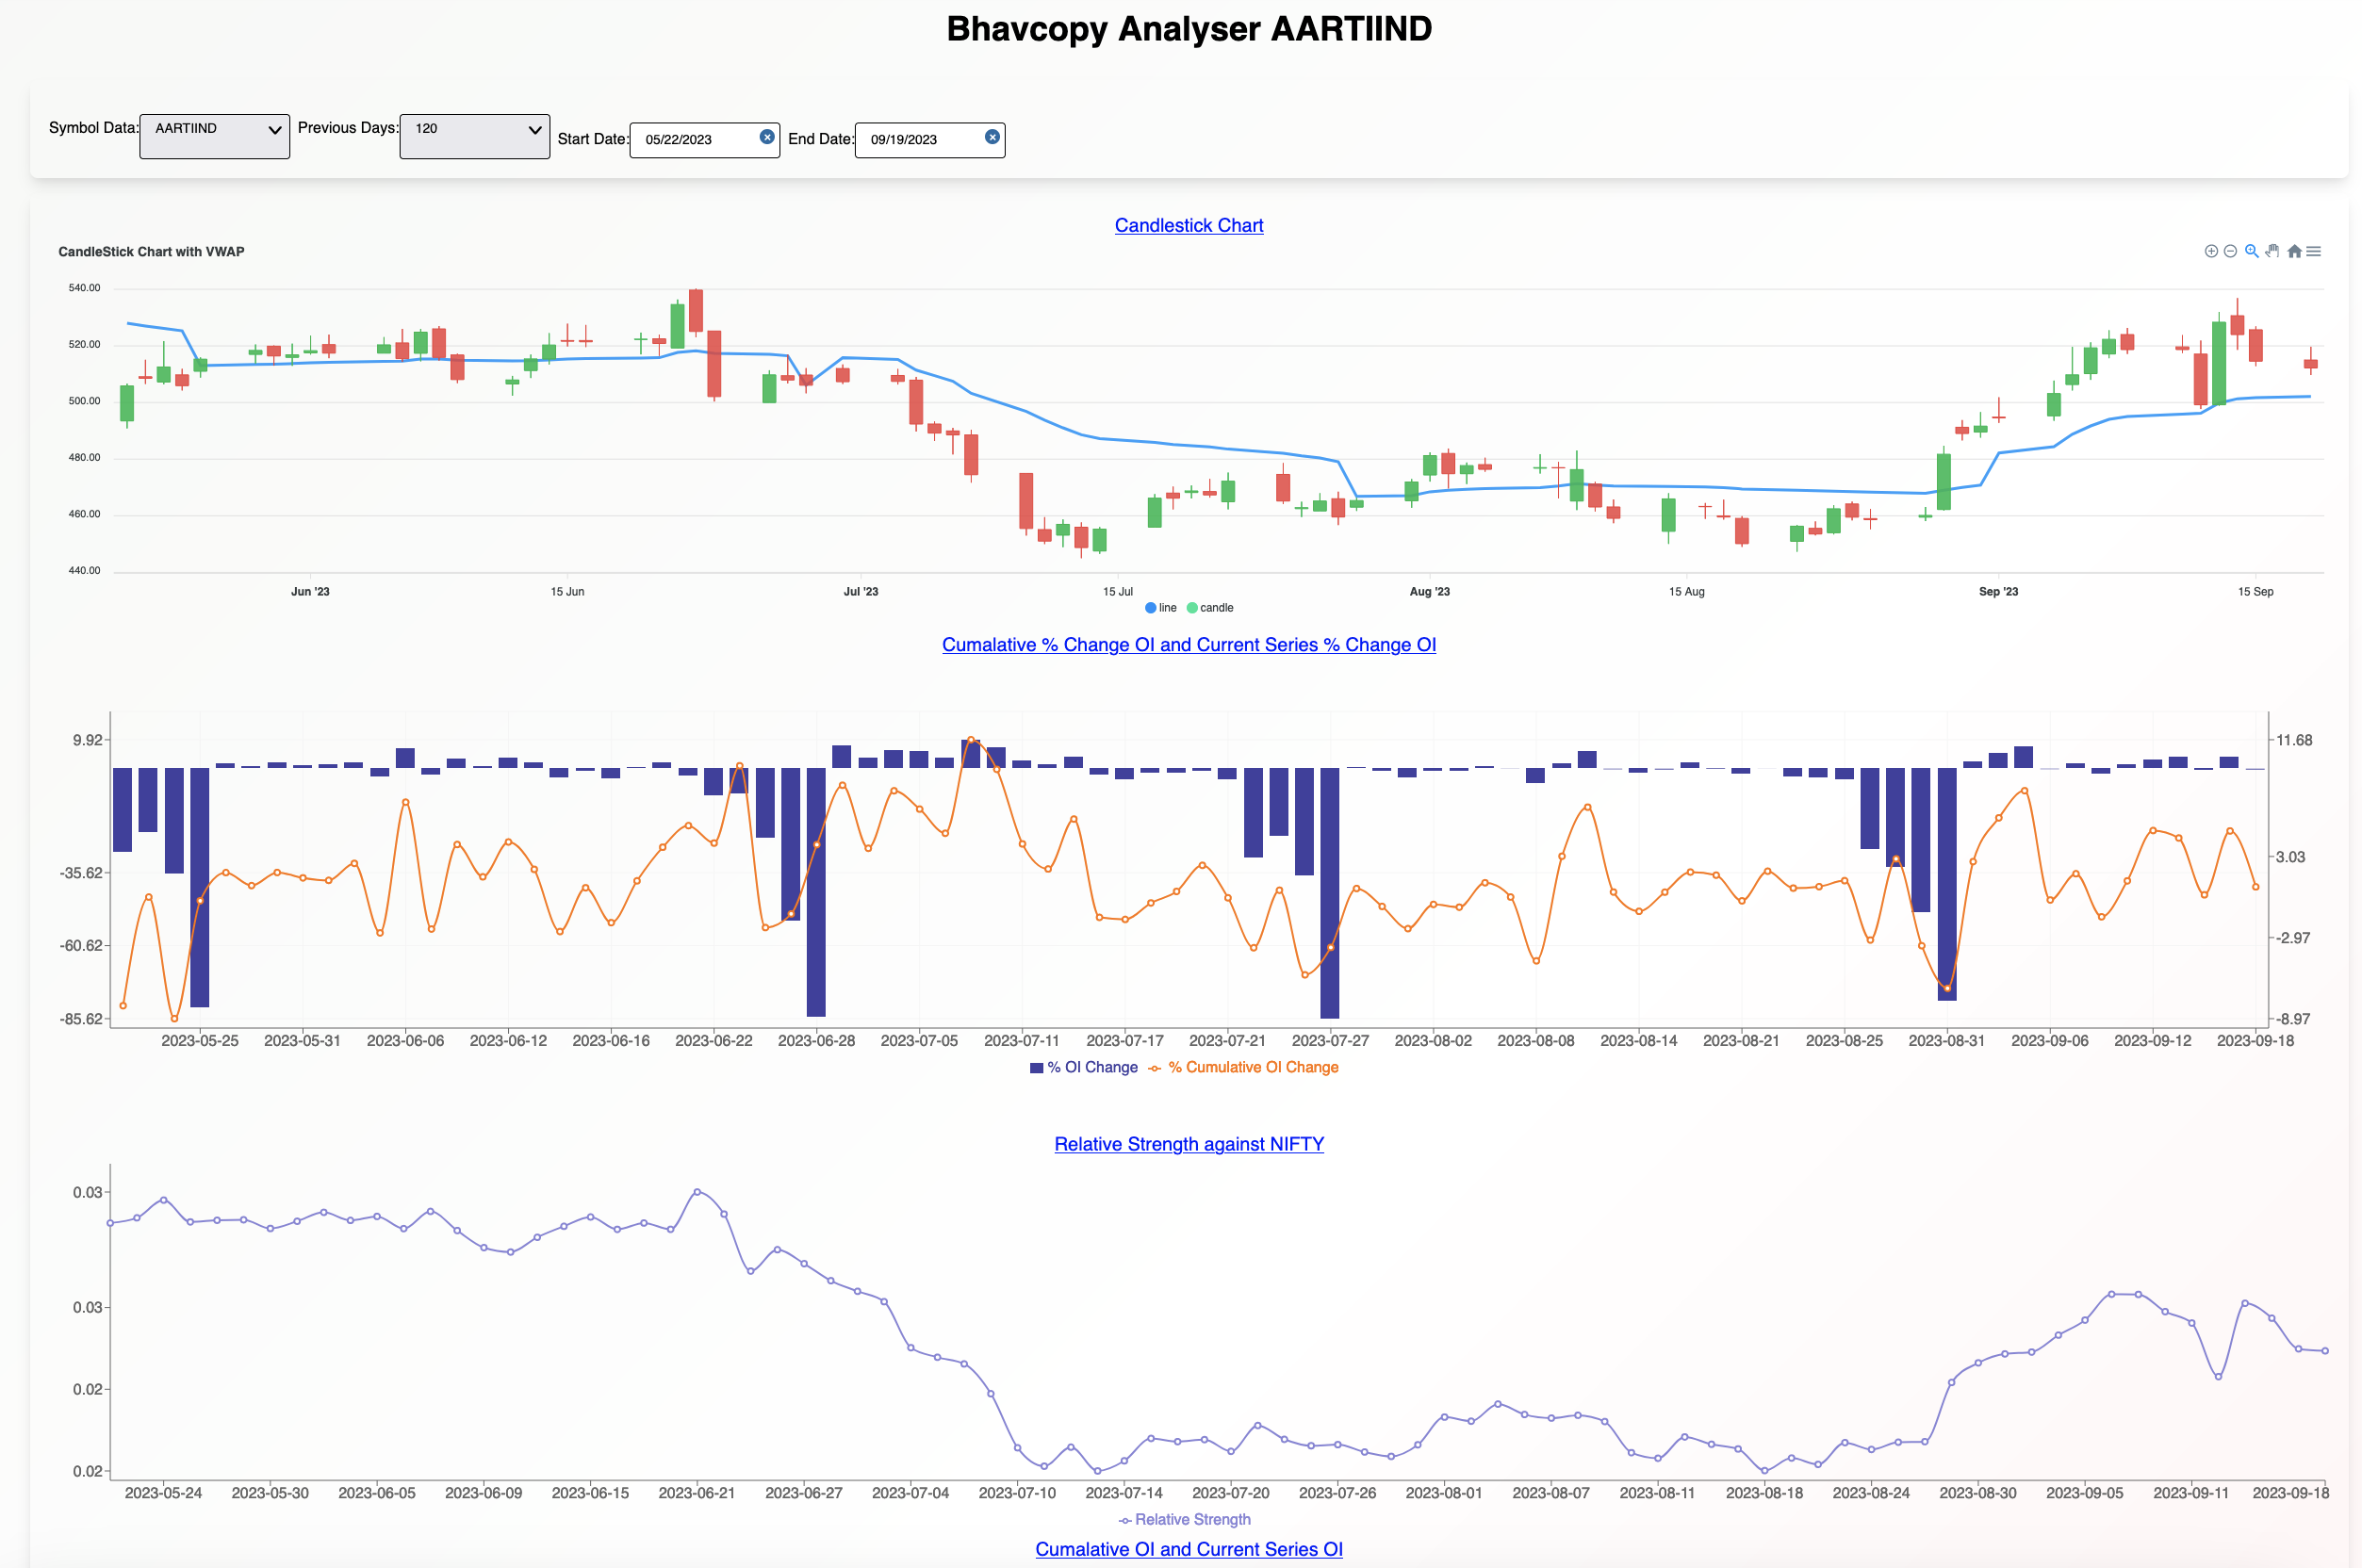
- Symbol and window. The selected symbol and date range define the historical analysis.
- Price and VWAP. Read the daily price structure with the plotted volume-weighted reference.
- Daily and cumulative OI. The two measures use different baselines; do not compare their heights as the same quantity.
- Relative strength. The relative series compares the selected instrument with its benchmark.
- Select the symbol and a lookback or custom date range.
- Read price structure and VWAP for the same period.
- Compare daily OI changes with cumulative positioning to distinguish one session from the entire window.
- Check the basis, relative strength and contract transitions before describing a buildup.
Read a numerical example
If OI rises from 1,00,000 to 1,10,000 on day one and then 1,15,000 on day two, the final day increase is 5,000 contracts and the two-day cumulative increase is 15,000. These are different baselines, even though they describe the same final observation.
Illustrative arithmetic only; this is not a current signal or a trade recommendation.