
Match the comparison window and units
| Field group | Interpretation |
|---|---|
| Start / Now / Chg % | Price movement across the selected history window |
| OI and OI change | Outstanding contracts and their change across the window |
| Volume / volume change | Trading activity, under the selected quantity or lot display |
| Turnover in ₹ crore | A value measure rather than contract count |
| Daily price / OI % | Change relative to the previous day, shown separately |
Build a futures filter
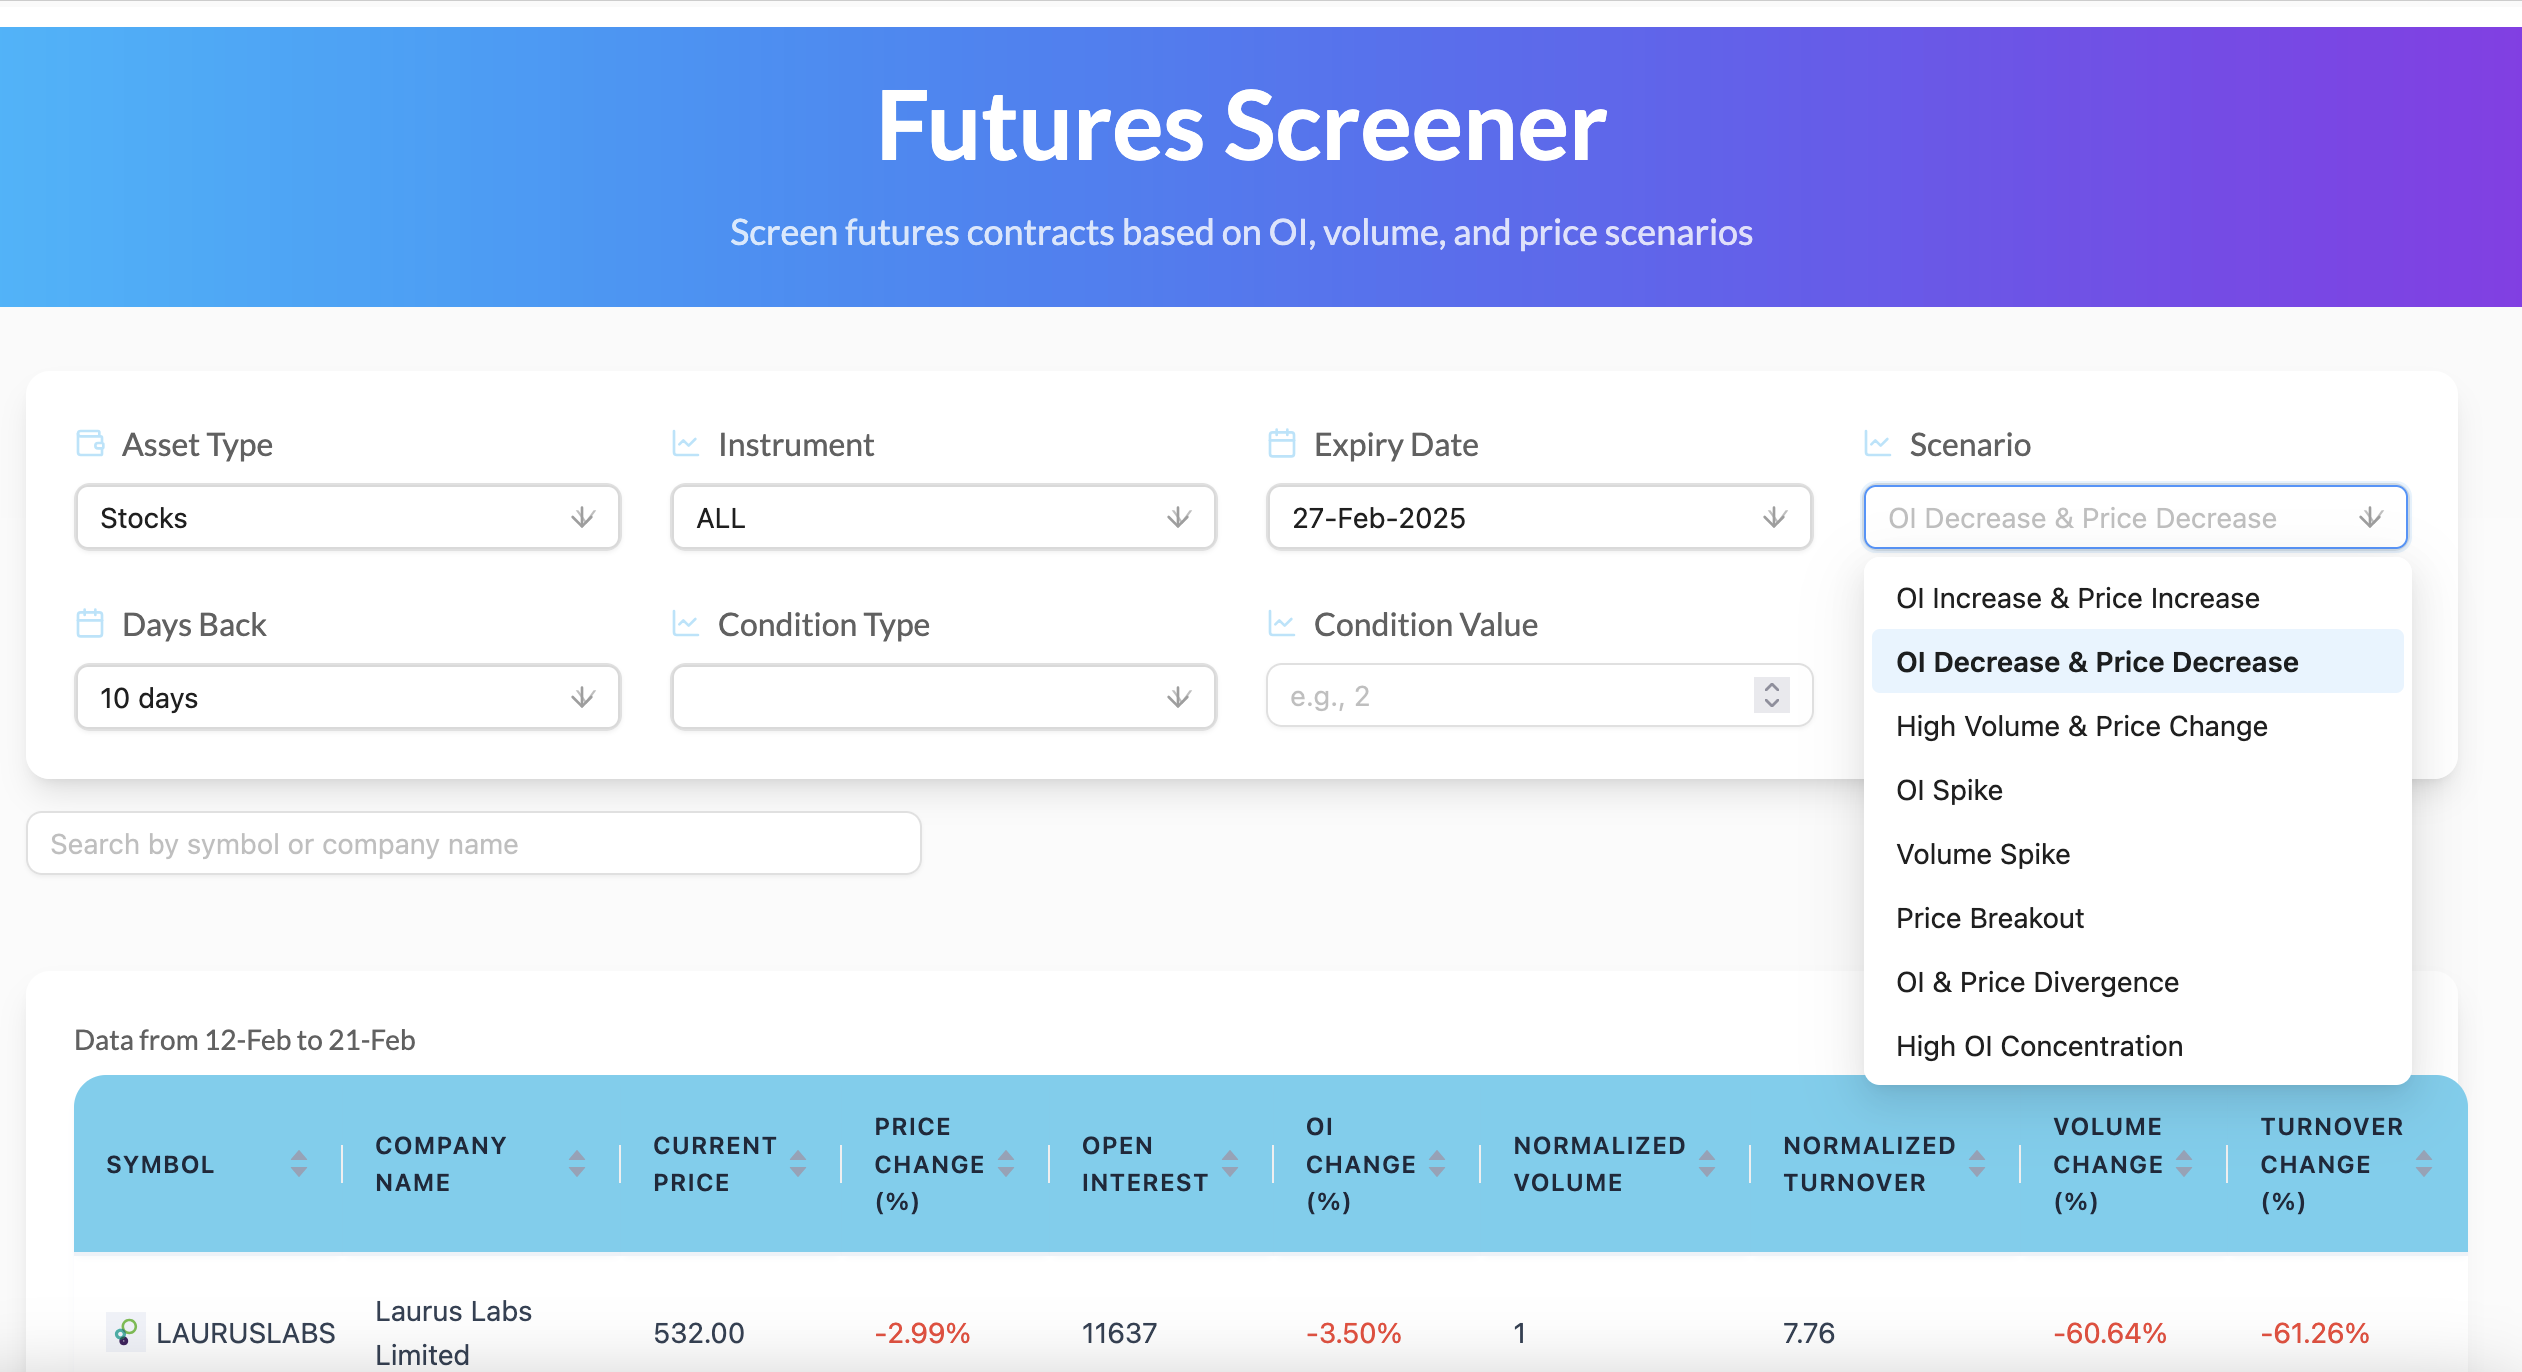
- Select contract scope. Asset type and instrument determine the available contracts.
- Choose expiry. Keep the expiry consistent when comparing history-window changes.
- Choose a scenario. A preset applies a numerical condition rather than a trading instruction.
- Set the window. Days Back changes the starting observation used for the window return.
- Open Futures Screener and select asset type, instrument scope and expiry.
- Choose the history length and confirm whether expiries are being combined.
- Start with a preset scenario or enter a manual condition and numeric threshold.
- Read volume units before comparing rows; a lot count and a raw quantity are different numbers.
- Select a symbol to inspect its day-by-day chart and distinguish window change from the latest daily change.
A daily rise can coexist with a falling window
A futures price can rise from 98 to 99 today while still being below 105 at the start of a five-session window. The latest daily return is positive, while the window return is negative. Neither field is wrong; they answer different time-horizon questions.
Contract changes require context
- Every futures contract has a long and a short; rising OI does not identify a specific new buyer or seller.
- Rollover shifts activity between expiries, so compare consistent scope.
- Combined expiry totals can conceal a reduction in one contract and increase in another.
- Price/OI scenarios are filters, not measured trade outcomes.