
What this view helps you inspect
Use the matrix to investigate when a strike-level change appeared and whether it persisted into later observations. First fix the instrument, expiry, source date and selected measurement. The same cell position has a different meaning when the measure changes from an absolute quantity to a change series.
Calls and puts may display timestamps in opposite visual order around the central strike. Read the actual column labels instead of assuming that moving right always means moving forward in time. Transpose changes the layout. Cumulative mode changes the aggregation, so it should be treated as a separate comparison.
Screenshot: controls and measurements
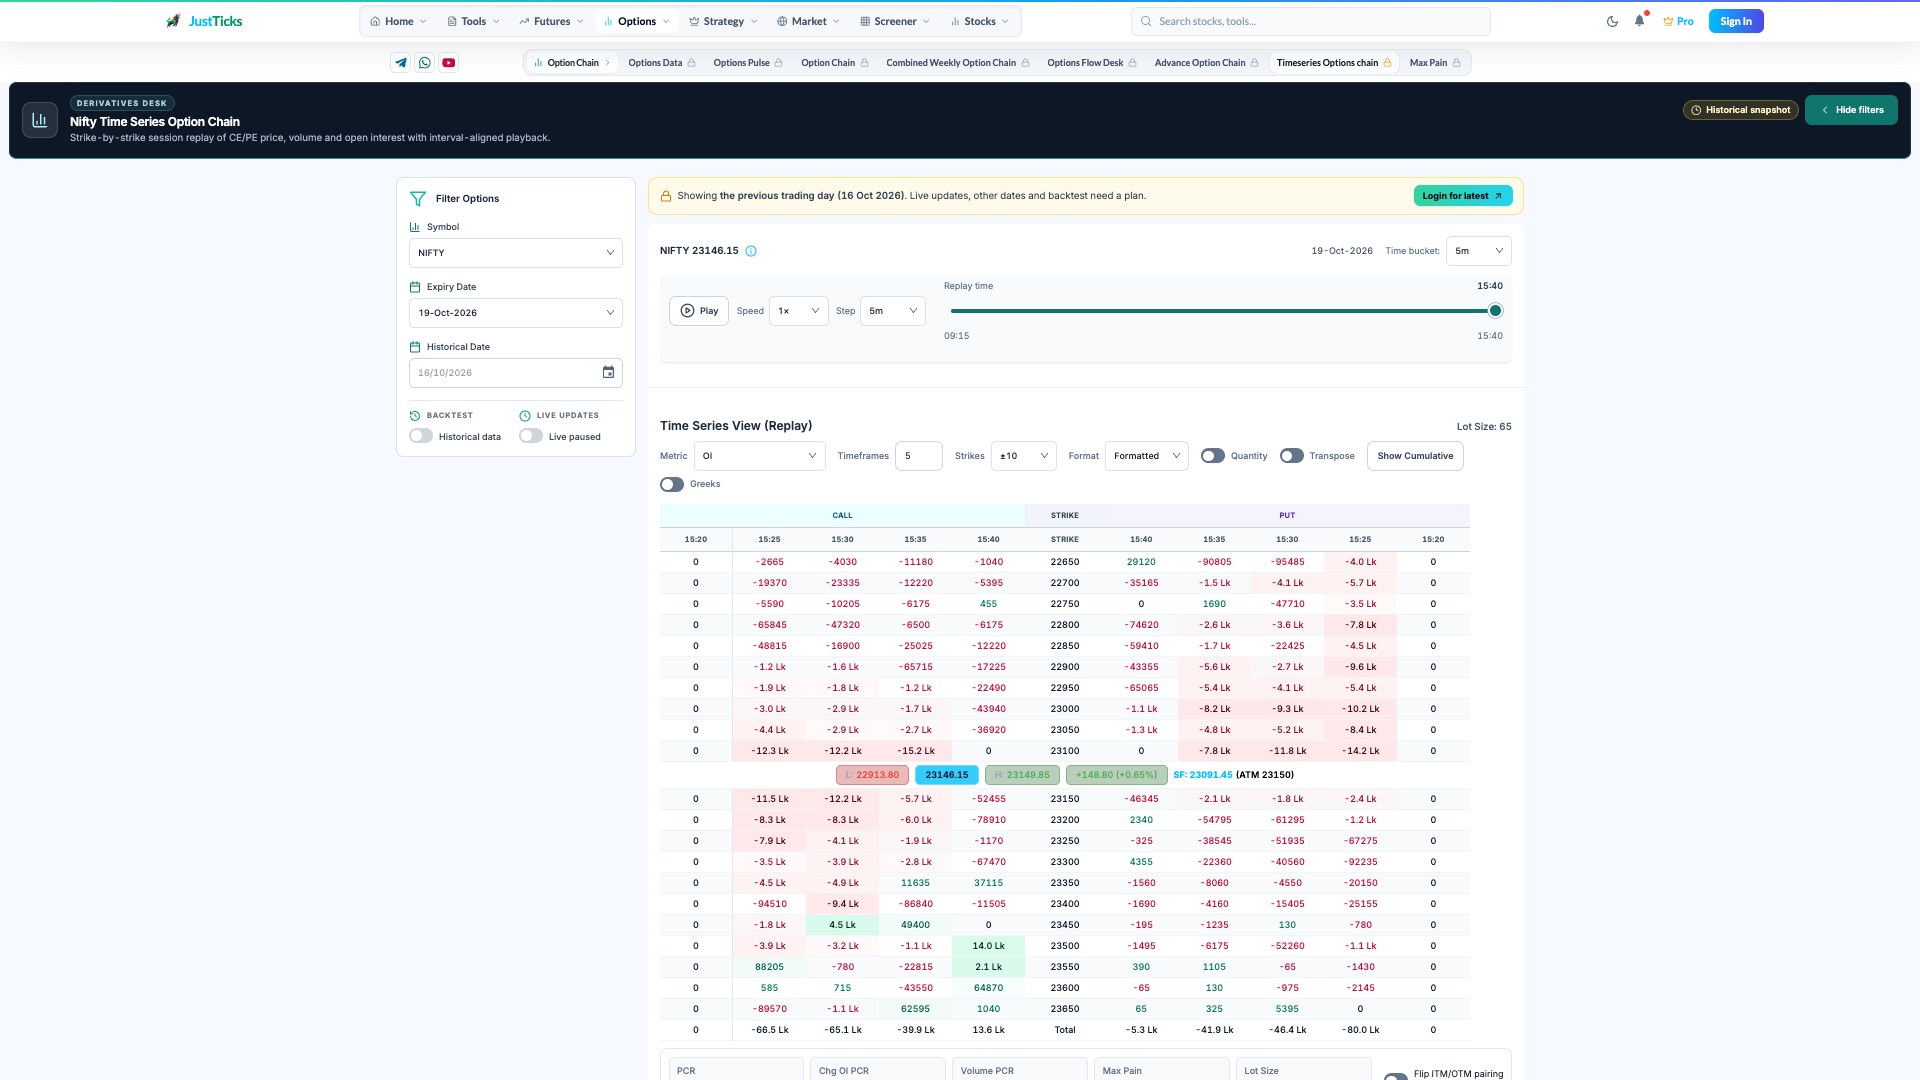
- Set expiry and session. The preview date belongs to the pictured historical observation.
- Confirm the measurement. A change series differs from an outstanding position level.
- Read timestamps on both sides. CE and PE columns can run in opposite visual order.
- Check layout and aggregation. Transpose and cumulative controls change how the matrix is read.
Read the fields before the colours
| Field | How to read it |
|---|---|
| Strike and side | The strike and CE/PE block locate a contract within the selected expiry. |
| Timestamp | Observation time for that column, not the time at which you opened the page. |
| Selected measurement | Defines whether a cell represents OI, a change, volume, premium or another supported field. |
| Cumulative mode | Changes the aggregation; confirm its reference before comparing with the interval view. |
| Greeks toggle | Adds model-derived sensitivity fields where the underlying data is available. |
| Totals and ratios | Summarise only the displayed or covered population under the current controls. |
How to use the tool step by step
- Choose the instrument and expiry, then confirm the session date. The public preview can show a past session.
- Select the measurement and observation interval. Record whether you are inspecting a level or a change.
- Locate one strike and read its CE timestamps in their labeled order.
- Read the matched PE timestamps separately. Do not assume both sides progress in the same visual direction.
- Compare a sustained sequence with a single isolated large cell. Check source gaps before interpreting persistence.
- Use transpose or cumulative view to answer a different question, then return to the original settings before comparing results.
Worked example: keep the measurements separate
Suppose the interval OI changes at one strike are +10,000, −4,000 and +6,000. Their sum is +12,000, but the last interval change is only +6,000. A cumulative presentation may make the sequence look continuously elevated even though one interval reduced positions. Compare the labeled timestamps and the selected aggregation before describing the pattern as uninterrupted buildup.
Limits and common interpretation mistakes
Colours encode the selected measurement and scale, not a probability of a future move. Missing snapshots, a changing strike range or an expiry switch can interrupt comparisons. Cumulative OI changes, absolute OI and traded volume are different quantities. The matrix does not reveal which side initiated a trade or whether a change belongs to a hedge or multi-leg position.