
What this view helps you inspect
Use this page to compare individual contracts within an expiry. Choose a strike, read its call and put values, and check whether the quote has meaningful participation. A chain snapshot is different from the Options Data bar charts and from the Timeseries matrix, which compares observations through time.
The pictured premium curve shows the displayed OTM put premiums below spot and OTM call premiums above spot. It combines different contracts across the strike axis; it is not one position’s payoff or a forecast distribution. The most-active lists provide another way to locate contracts for inspection.
Screenshot: controls and measurements
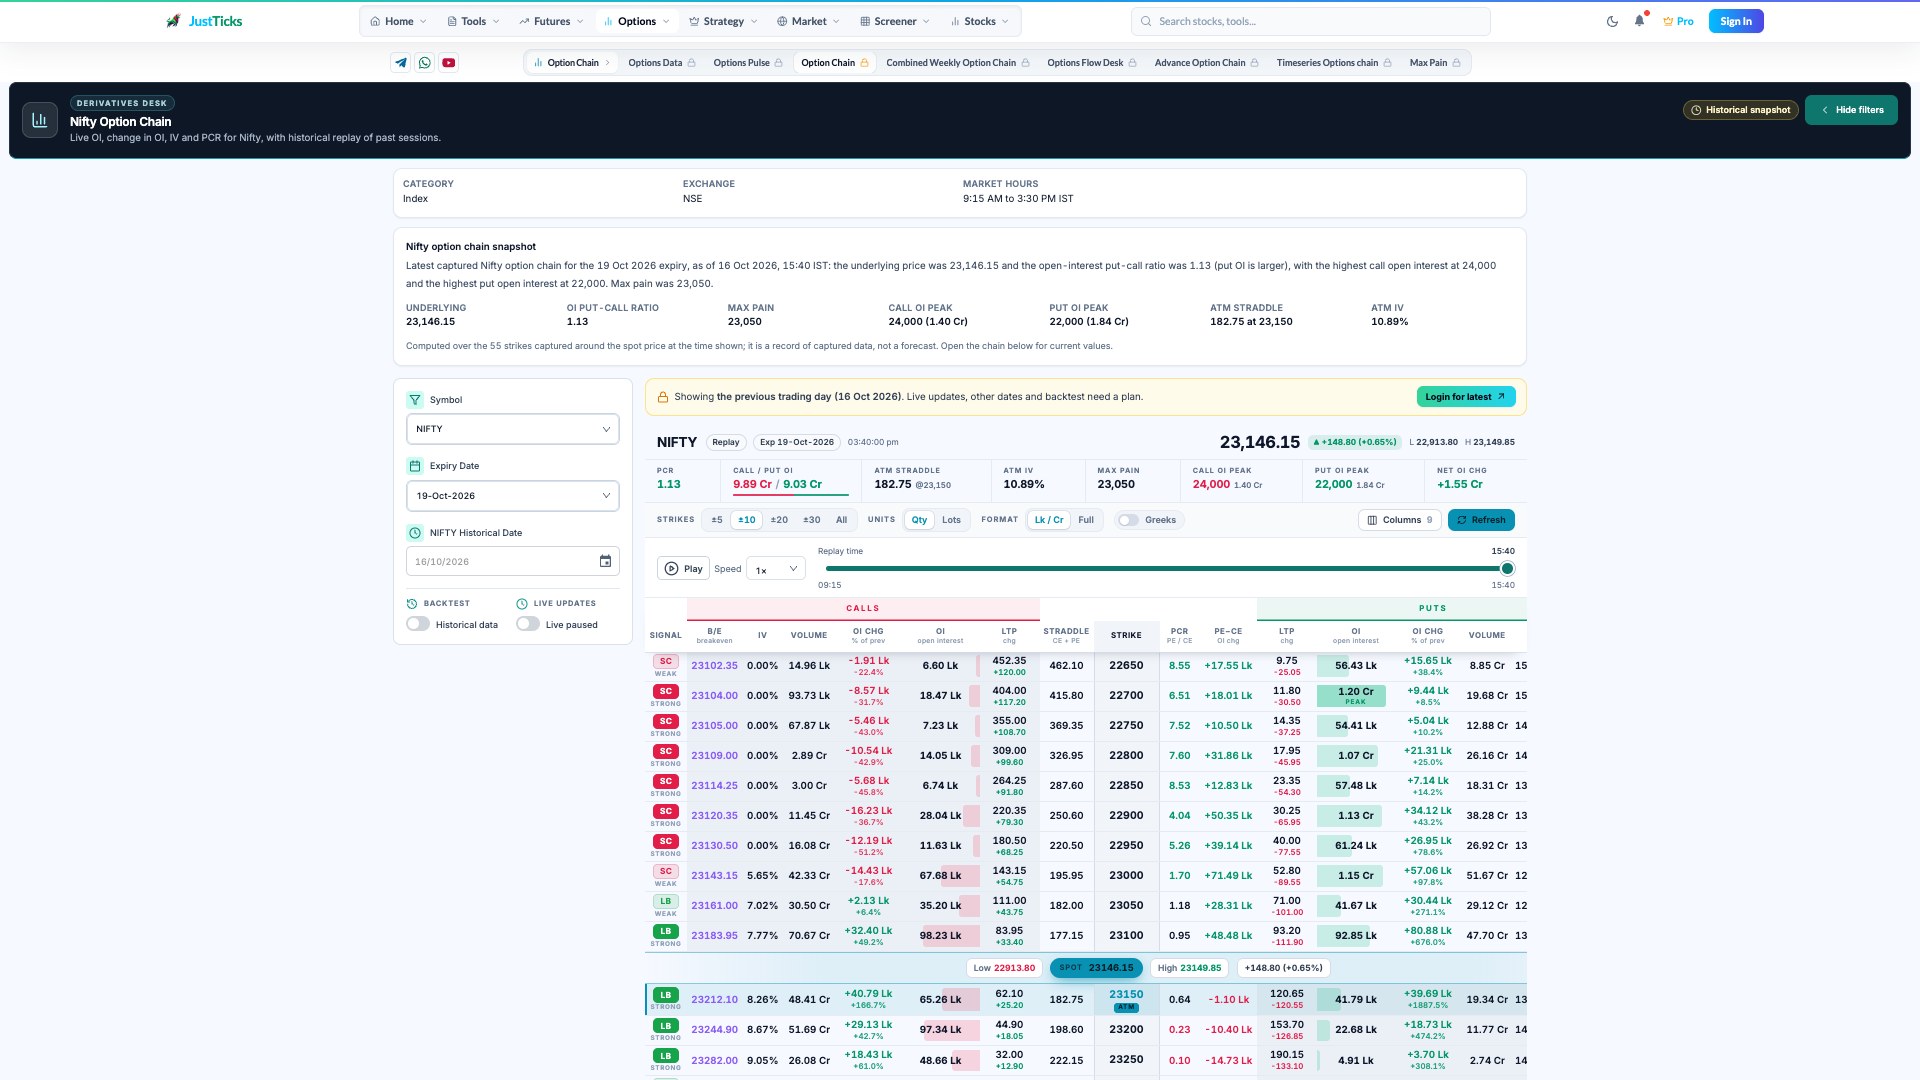
- Select the contract. Confirm the instrument, expiry and pictured source session.
- Check snapshot freshness. The summary records a captured observation, not an executable live quote.
- Replay the session. The timeline selects an observation within the pictured session.
- Read matched strikes. Compare CE and PE fields across the same strike row.
Read the fields before the colours
| Field | How to read it |
|---|---|
| Strike and option side | Strike plus CE or PE and expiry identifies the contract being compared. |
| LTP | The last traded premium; it may be stale and is not a guaranteed executable price. |
| Open interest | Outstanding positions reported for the contract at the observation. |
| Change in OI | Difference from the stated reference, not the number of trades during that period. |
| Volume | Reported trading activity for the stated scope and units. |
| IV | Model-implied volatility from option pricing inputs; it describes uncertainty rather than direction. |
How to use the tool step by step
- Select the instrument and expiry. Note the source date, especially when the page shows a previous-session preview.
- Locate the underlying price and ATM area before comparing strikes. Keep the expiry fixed during the first pass.
- Read the call and put at the same strike. Compare premium, OI, OI change, volume and available IV as separate fields.
- Inspect the premium curve using its own axes. A high point reflects the displayed contract selection, not a return probability.
- Use the most-active lists to locate unusual volume or OI changes, then inspect their contracts rather than relying on rank alone.
- For a historical session, confirm the chosen date and replay observation. Open the Timeseries view when the question requires several timestamps together.
Worked example: keep the measurements separate
Consider two calls at the same expiry. One has high OI but little current volume; another has smaller OI but much larger session volume. The first is more heavily held, while the second is more actively traded during the session. Neither fact by itself tells you which contract has the narrower spread or whether its last price can be traded now. Comparing the matched put helps describe the chain, but a put-call ratio still does not establish trade direction.
Limits and common interpretation mistakes
Keep expiry, observation time and units consistent. Quotes may be missing or stale, and an apparent IV difference may reflect an unreliable premium. OI concentration is not an order-book wall and can move before price reaches a strike. The chain does not reveal every participant’s motive. Historical observations describe the selected past session and do not become live quotes when opened today.