
What this view helps you inspect
Use this view after identifying the instrument, expiry and observation period. Calls and puts appear on opposite sides of a central strike area, with fields such as straddle premium, PCR and derived levels available alongside the contract measurements. The columns are dense, so the field headers and units matter more than the colour of a highlighted cell.
The refreshed-at label and selected timeframe define the observation context. The interpretation column summarises a price/OI relationship according to the tool’s rules. Derived support/resistance fields are reference calculations; they are not standing market orders or guaranteed future prices.
Screenshot: controls and measurements
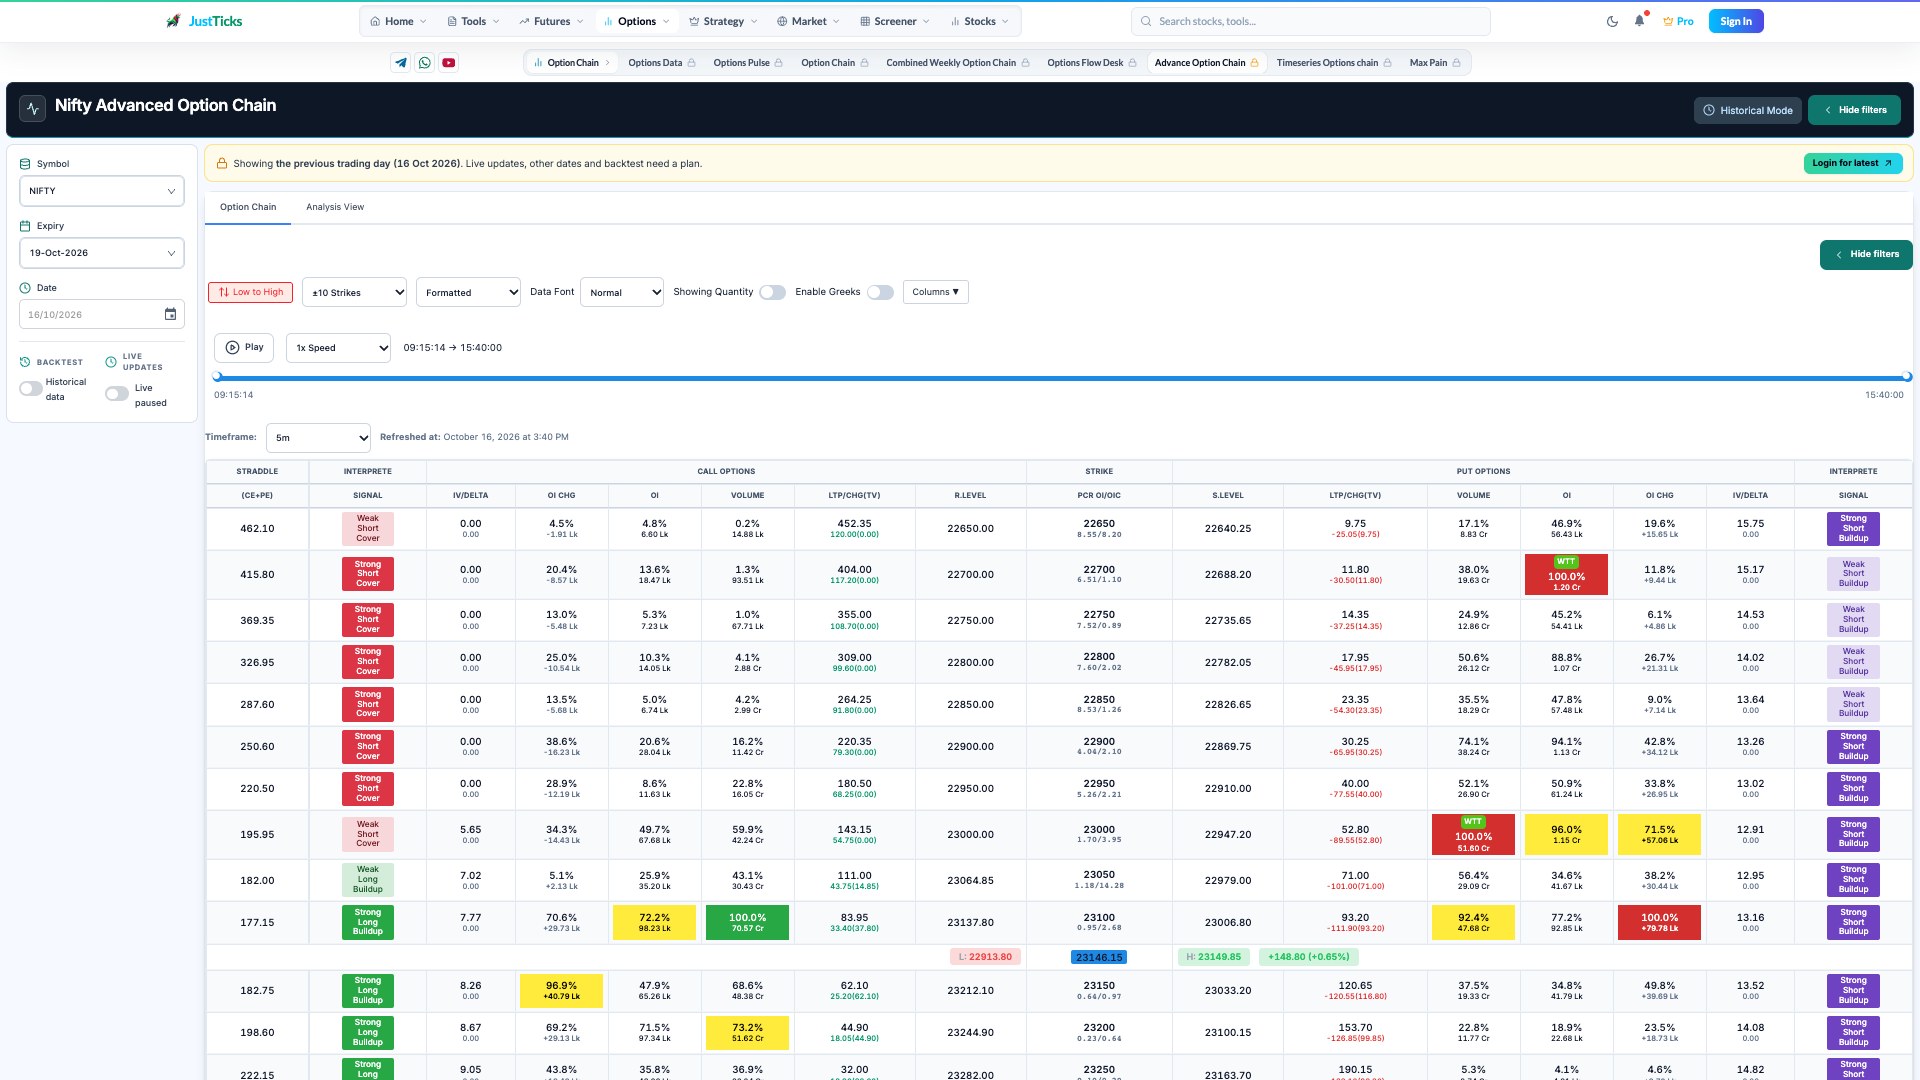
- Confirm the expiry. The table belongs to the selected underlying and expiry.
- Set the interval. Check timeframe and refreshed-at time before comparing changes.
- Find the strike column. Read matched calls and puts across one row.
- Treat labels as classifications. Badges summarise price/OI inputs and do not identify a participant.
Read the fields before the colours
| Field | How to read it |
|---|---|
| LTP and premium change | Last premium and change from the stated reference; inspect the label rather than assuming a session-to-session comparison. |
| OI and OI change | Outstanding positions and their change at the selected contract. |
| Volume | Reported trading activity, which can include repeated trading of existing positions. |
| IV / delta | Model-derived volatility and sensitivity fields; preserve their displayed units. |
| Straddle (CE + PE) | Combined premium of the paired call and put at the stated strike and expiry. |
| Interpretation / levels | Derived classifications and reference levels that depend on the measured inputs and model rules. |
How to use the tool step by step
- Select the underlying, expiry and session date, then check the refreshed-at label.
- Choose the timeframe before comparing adjacent observations. Changing the interval changes the reference for some change fields.
- Start at the central strike column and locate the underlying-price reference.
- Read CE and PE premium, OI, change in OI and volume at one strike. Separate absolute quantity from percentage change.
- Inspect IV/delta, straddle and derived reference levels after validating the basic data.
- Read interpretation badges as classifications. Verify their inputs in the standard chain or time-based view before using them in a broader analysis.
Worked example: keep the measurements separate
A call premium falls while its OI rises. A classification may describe that combination as consistent with short buildup. The observation still contains both a long and a short side to each open contract. Spread transactions, hedges and shifts in IV or the underlying can produce the same combination. Check whether the interval has sufficient volume and compare the paired put before assigning a directional interpretation.
Limits and common interpretation mistakes
Model labels do not identify actual institutions, aggressive trade direction or complete portfolios. IV, delta and derived levels depend on input quality and calculation assumptions. LTP can be stale, particularly far from ATM. A highlighted OI field is not a firm support or resistance order. Do not compare percentages across different intervals or expiries as if they share one baseline.