
What this view helps you inspect
Use the tool to inspect the shape of the expiry payout distribution and how its minimum changes as OI changes. The calculation asks what the reported open contracts would pay in intrinsic value at each tested settlement strike. It does not calculate the realised profit of all traders, because entry premiums, closed trades and complete portfolios are not known.
The implementation also has a modified distance-weighted calculation that gives strikes closer to the current spot more influence. This is a separate model result. The standard calculation already uses OI, so a modified or weighted label should not be read as meaning that the standard result ignores open interest.
The OI Center of Mass card is an OI-weighted average strike. It is a separate positioning reference and can differ from both the standard payout minimum and the modified distance-weighted result. Similar levels do not turn these separate calculations into a probability of a price move.
Screenshot: controls and measurements
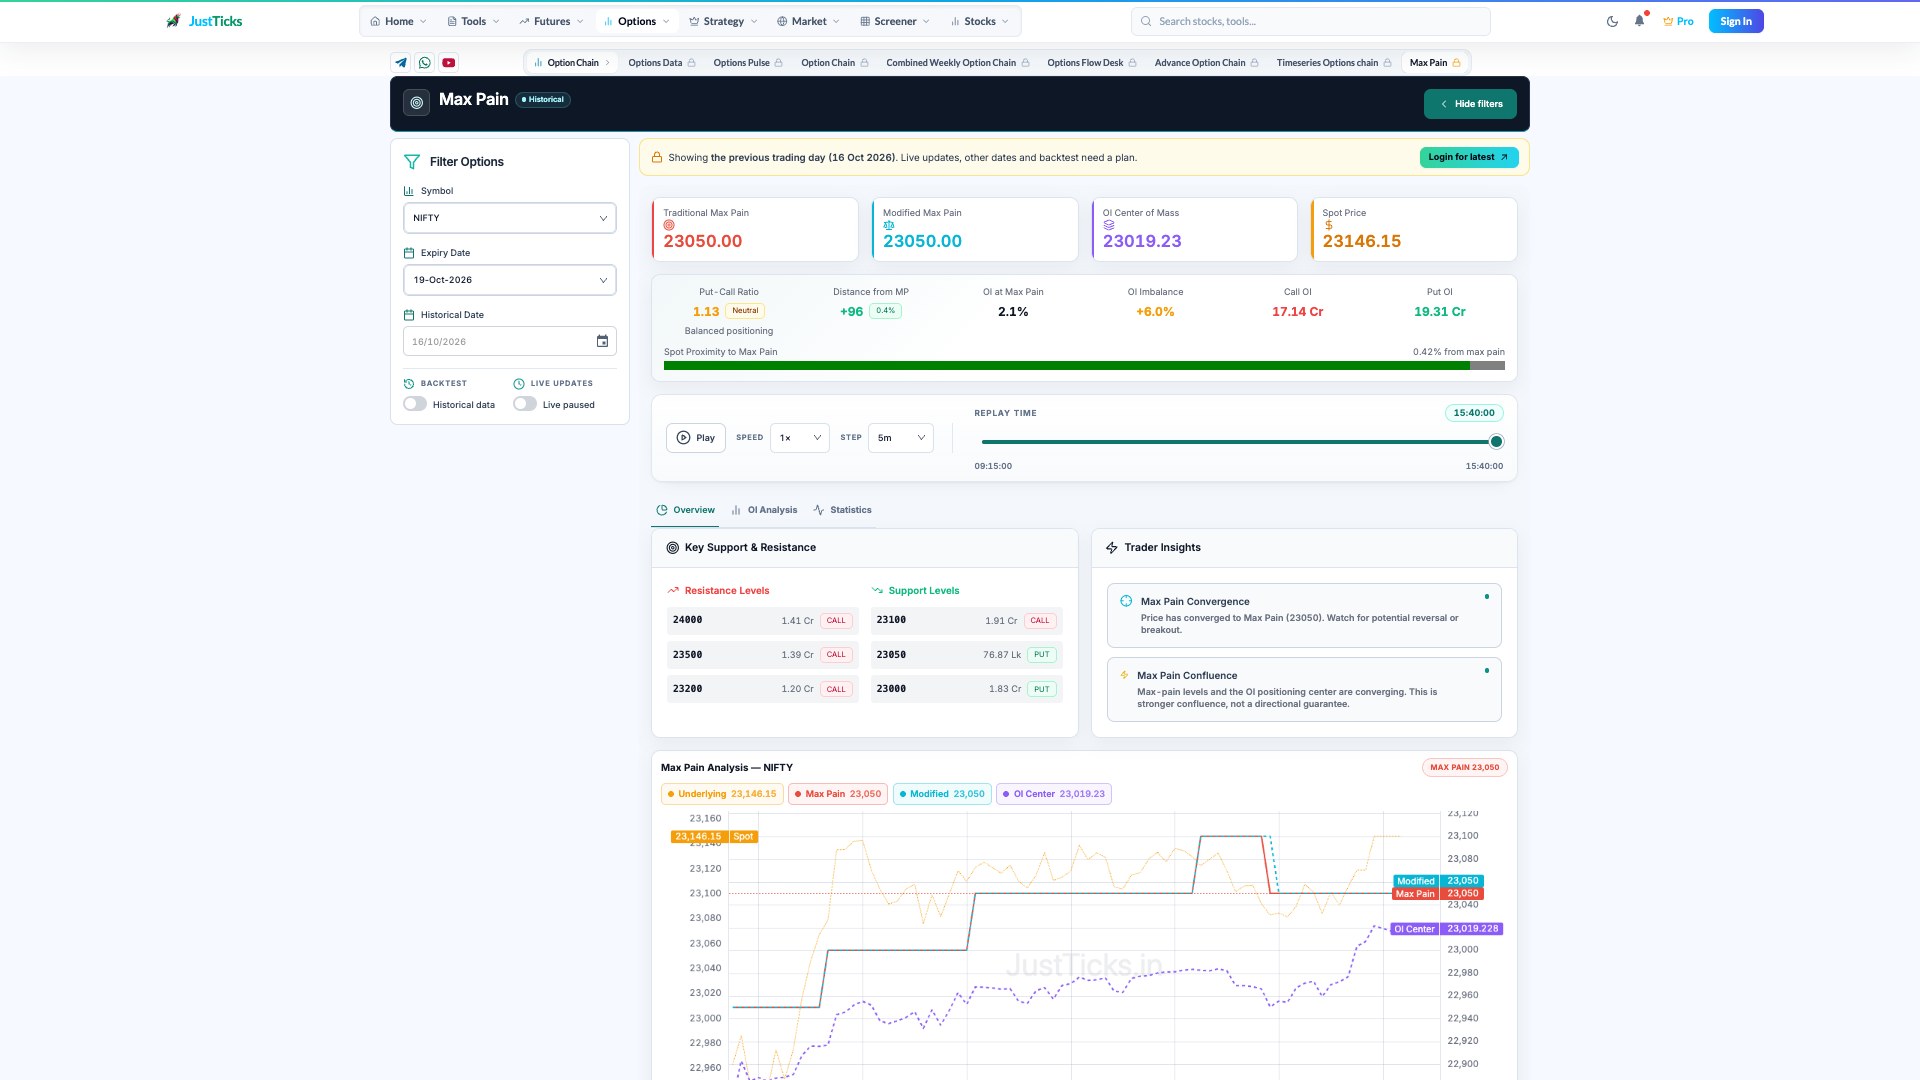
- Choose the expiry. Fix the expiry and source session before comparing calculated levels.
- Read standard max pain. This is a minimum intrinsic-payout calculation, not a price target.
- Separate the modified result. The modified value uses an additional distance-from-spot weighting.
- Inspect replay observations. The line chart tracks calculated levels over the selected session.
Read the fields before the colours
| Field | How to read it |
|---|---|
| Standard max pain | The tested settlement strike with the smallest summed intrinsic payout under the observed OI distribution. |
| Call payout | For each call strike K and settlement S, OI × max(S − K, 0). |
| Put payout | For each put strike K and settlement S, OI × max(K − S, 0). |
| Modified result | A separate calculation using distance-from-spot weights in addition to OI. |
| OI center of mass | Average strike weighted by combined call and put OI; this is a positioning reference, not another minimum-payout result. |
| Spot gap | Difference between the underlying price and the calculated minimum; not a calibrated expected return. |
| History / replay | Available observations showing how the calculated level changes with the input snapshot. |
How to use the tool step by step
- Choose the underlying and one expiry. Confirm the session date and the displayed source timestamp.
- Locate the standard minimum-payout strike and compare it with the shape of the full payout curve.
- Read the underlying price separately. A large gap does not establish a direction or convergence deadline.
- Compare standard and modified values only after checking which weighting method each label represents.
- Inspect available historical observations or replay to see whether the minimum is stable or moving as OI changes.
- Open the option chain to inspect the contracts and strike coverage behind an unexpected shift.
Worked example: keep the measurements separate
Consider one call with OI 2 at strike 100 and one put with OI 3 at strike 110, using illustrative units. At settlement 100 the combined intrinsic payout is 30; at 110 it is 20. Of those two tested strikes, 110 has the lower payout. The calculation says nothing about the premiums paid, hedges held or which settlement is likely. If the input OI changes, the lower-payout strike can change too.
Limits and common interpretation mistakes
Price is not required to converge to max pain. Events, liquidity and changing positions can overwhelm any apparent expiry pinning. The result depends on expiry, strike coverage, OI units and quote availability; a shallow payout minimum can shift after a small input change. Equal-payout minima and the set of tested strikes also matter. Do not treat a modified weighting method as an independently observed market level.