
What this view helps you inspect
Use this view when the question is where activity is concentrated across the selected strike range, rather than which individual option to trade. The OI Change — Selected Replay Window chart compares observations over the chosen replay window. The separate open-interest and volume panels answer different questions and should be read separately.
The landing page and instrument URLs use the same family of measurements. Selecting a stock, commodity or another index changes the available contracts and sometimes their units. A larger bar only has meaning after the instrument, expiry, observation time and included strikes have been fixed.
Screenshot: controls and measurements
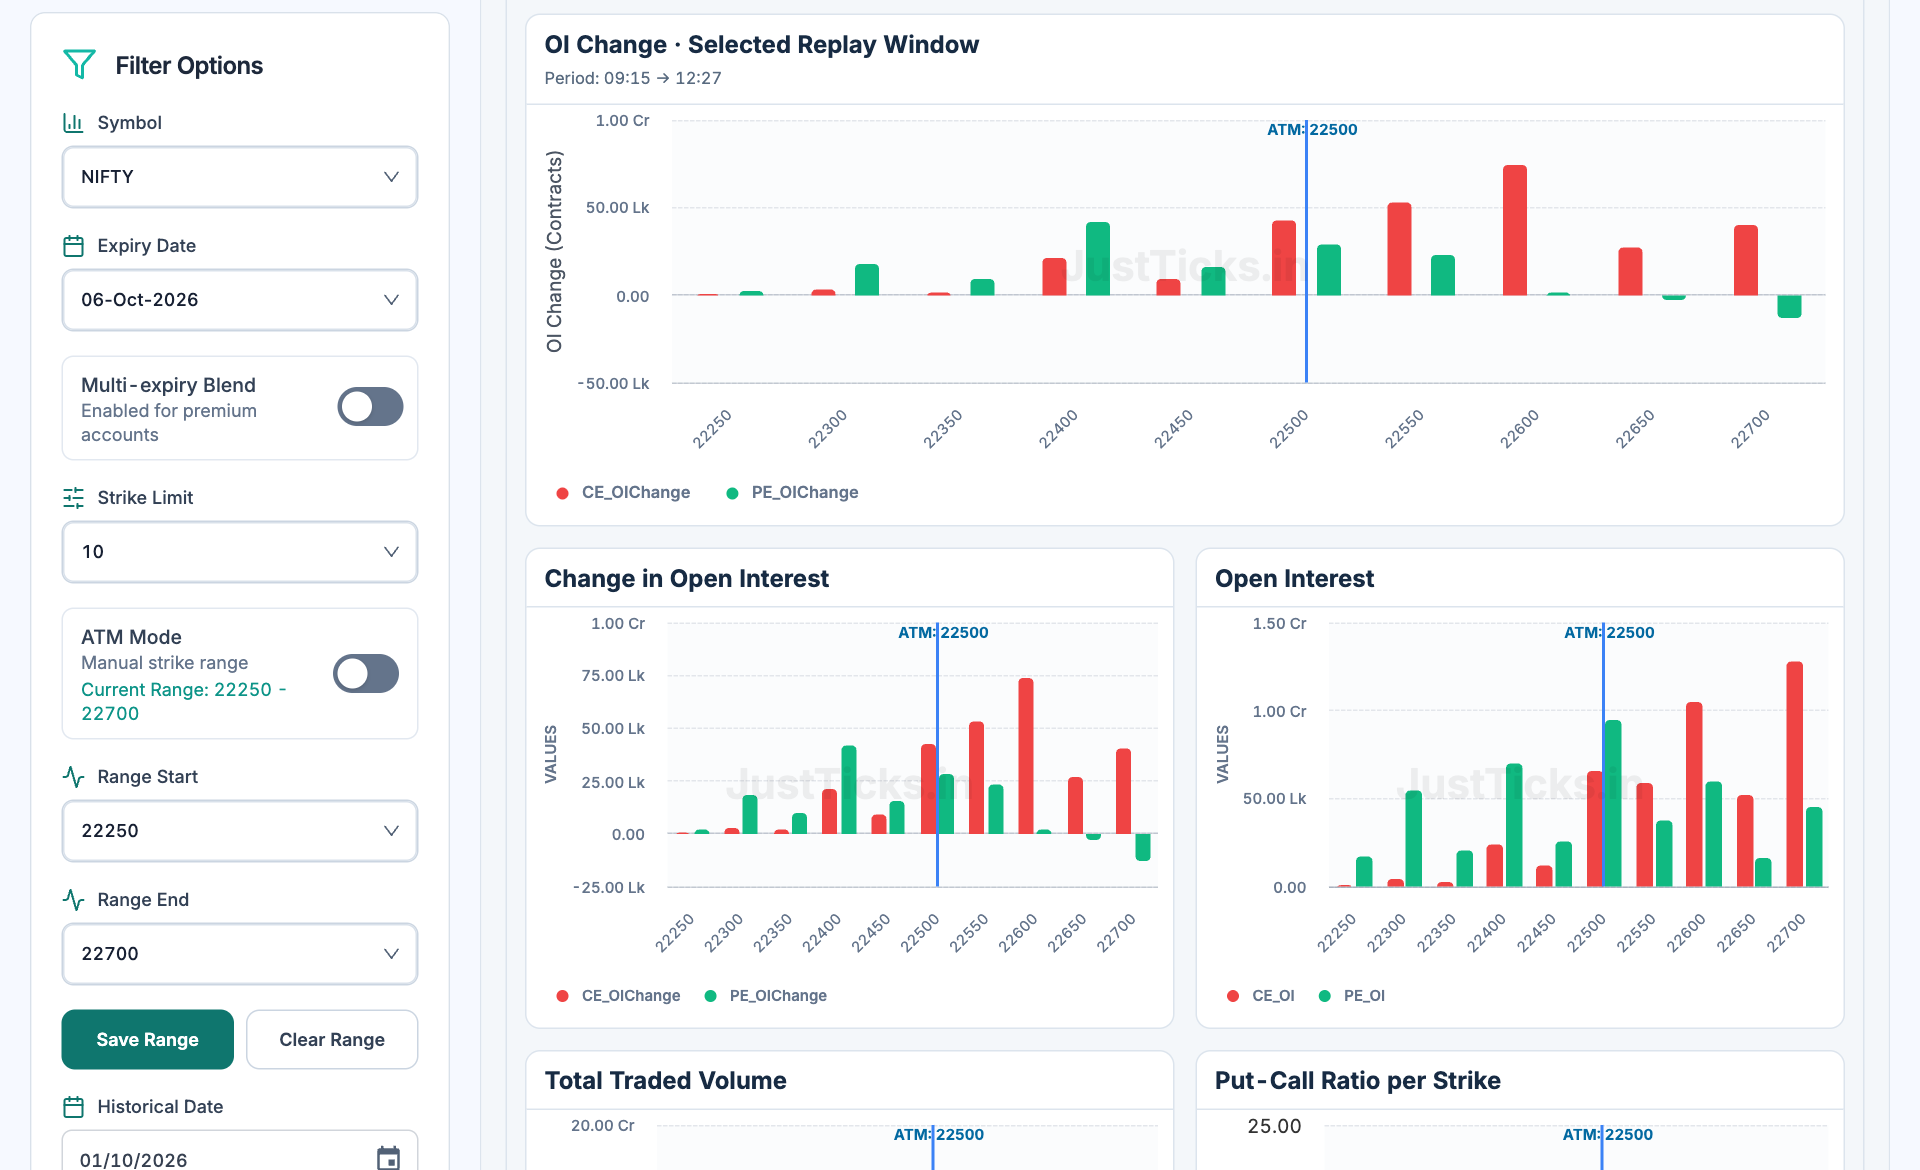
- Choose the contract. Fix symbol and expiry before comparing the bars.
- Set strike coverage. Use ATM mode or explicit range endpoints consistently.
- Read the selected window. The displayed start and end times define this OI-change comparison.
- Separate OI and OI change. Outstanding quantity and changes in quantity answer different questions.
Read the fields before the colours
| Field | How to read it |
|---|---|
| Open interest | Outstanding positions at the displayed observation; check the quantity or lot setting. |
| OI change | Difference from the chart’s stated comparison reference; it is not the total outstanding position. |
| Selected replay window | The start and end observations used by the window comparison. |
| Traded volume | Transactions counted by the source during the stated session or interval; a contract may trade repeatedly. |
| Strike coverage | The range included in the chart, controlled by strike limit, ATM mode or manual endpoints. |
| Strike PCR | Put-to-call ratio at the indicated strike, distinct from a whole-chain aggregate. |
How to use the tool step by step
- Choose the instrument and check the source session shown on the page. A previous-session preview is historical data.
- Select an expiry. Keep a single expiry while establishing a baseline; an enabled multi-expiry blend changes the covered population.
- Set the strike limit or manual range. Locate the ATM marker and confirm both range endpoints.
- Read total OI to find concentration, then inspect OI change to see which parts of that distribution changed.
- Choose the replay start and end points and the OI period. Compare windows of the same length.
- Use volume and the underlying price as additional context. Inspect the individual contract in the option chain before interpreting a bar.
Worked example: keep the measurements separate
Suppose one call strike has 20 lakh units of OI and adds 1 lakh during the selected interval, while another has 5 lakh and adds 2 lakh. The first still has the larger outstanding position; the second has the larger interval addition. A volume bar cannot resolve that distinction because the same contracts may trade more than once. Expanding the displayed strike range can also change an aggregate PCR without changing either of these two strikes.
Limits and common interpretation mistakes
OI does not identify the initiating buyer, seller or participant category. Every open contract has both sides. Rising OI combined with a premium change may be consistent with a positioning regime, but it does not prove writer intent, institutional activity or a future support level. Missing observations and changed expiry coverage can produce misleading comparisons.