
Design the comparison first
To compare strikes, keep underlying and expiry fixed. To compare expiries, keep the underlying and selected strike fixed where the contracts are available. Comparing different underlyings at the same absolute premium is less informative because spot, lot size and volatility differ.
The workspace supports up to four panels and multiple layouts. Each panel can have its own instrument, expiry and strike, with premium, VWAP, synthetic future and a strike chain. The layout choice changes how you inspect them, not the contract definitions.
Screenshot: independent comparison panels
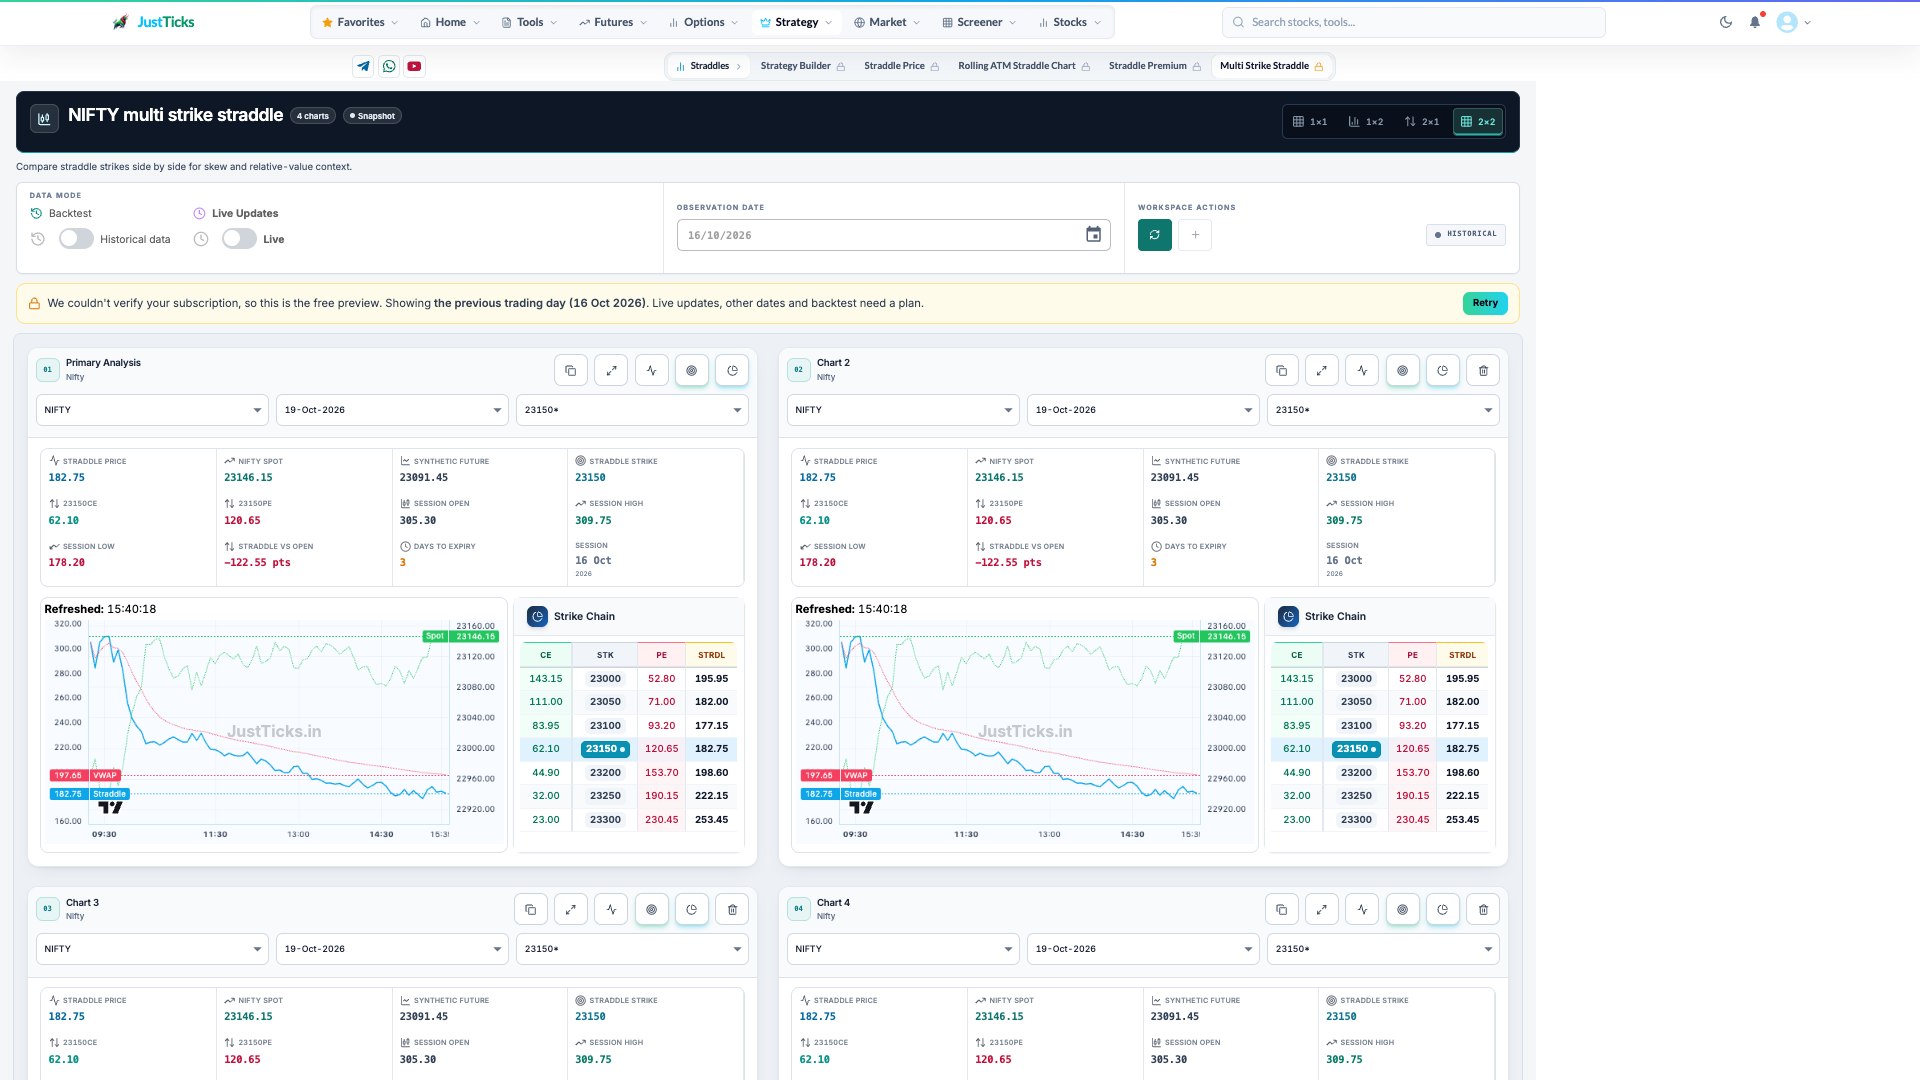
- Layout. Choose how many panels fit the comparison before changing contracts.
- Panel contract. Each panel has its own symbol, expiry and strike. Change one variable at a time.
- Premium chart. Straddle premium, VWAP and spot use different series and scales.
- Strike chain. Check the call, put and combined premium for the selected strike.
Compare two straddles
- Choose two panels before adding more. Select the same underlying for a controlled comparison.
- Set the same expiry and two nearby strikes, or one strike and two expiries, depending on your question.
- Check the session date and replay state for both panels.
- Read CE plus PE in each strike chain and verify the combined premium.
- Compare percentage movement or a common starting reference as well as point values. Use the single-chart guide if the CE/PE construction is unclear.
Worked example: point moves and percentage moves
Suppose panel A starts at 200 points and ends at 180, while panel B starts at 400 and ends at 380. Both fall by 20 points, but A falls 10% and B falls 5%. The comparison depends on whether you are measuring points or relative change.
No P&L follows without specifying which legs were bought or sold and their entry prices and quantities.
What side-by-side charts do not establish
Expiry differences include remaining time and event exposure. Stale prints can move one panel without a comparable observation in another. A premium gap is descriptive; it is not automatically an executable relative-value opportunity.