
Understand each pair before the total
Each strangle combines a call and a put at different strikes. On this workspace the pairs share the selected underlying, expiry and session, while the strike choices differ. Keep the identities of all legs explicit.
The combined-premium line sums the configured pair premiums. It does not define buy/sell actions, quantities, entry prices or a portfolio risk limit. A more expensive pair is not automatically a better trade.
Screenshot: separate pairs and their total
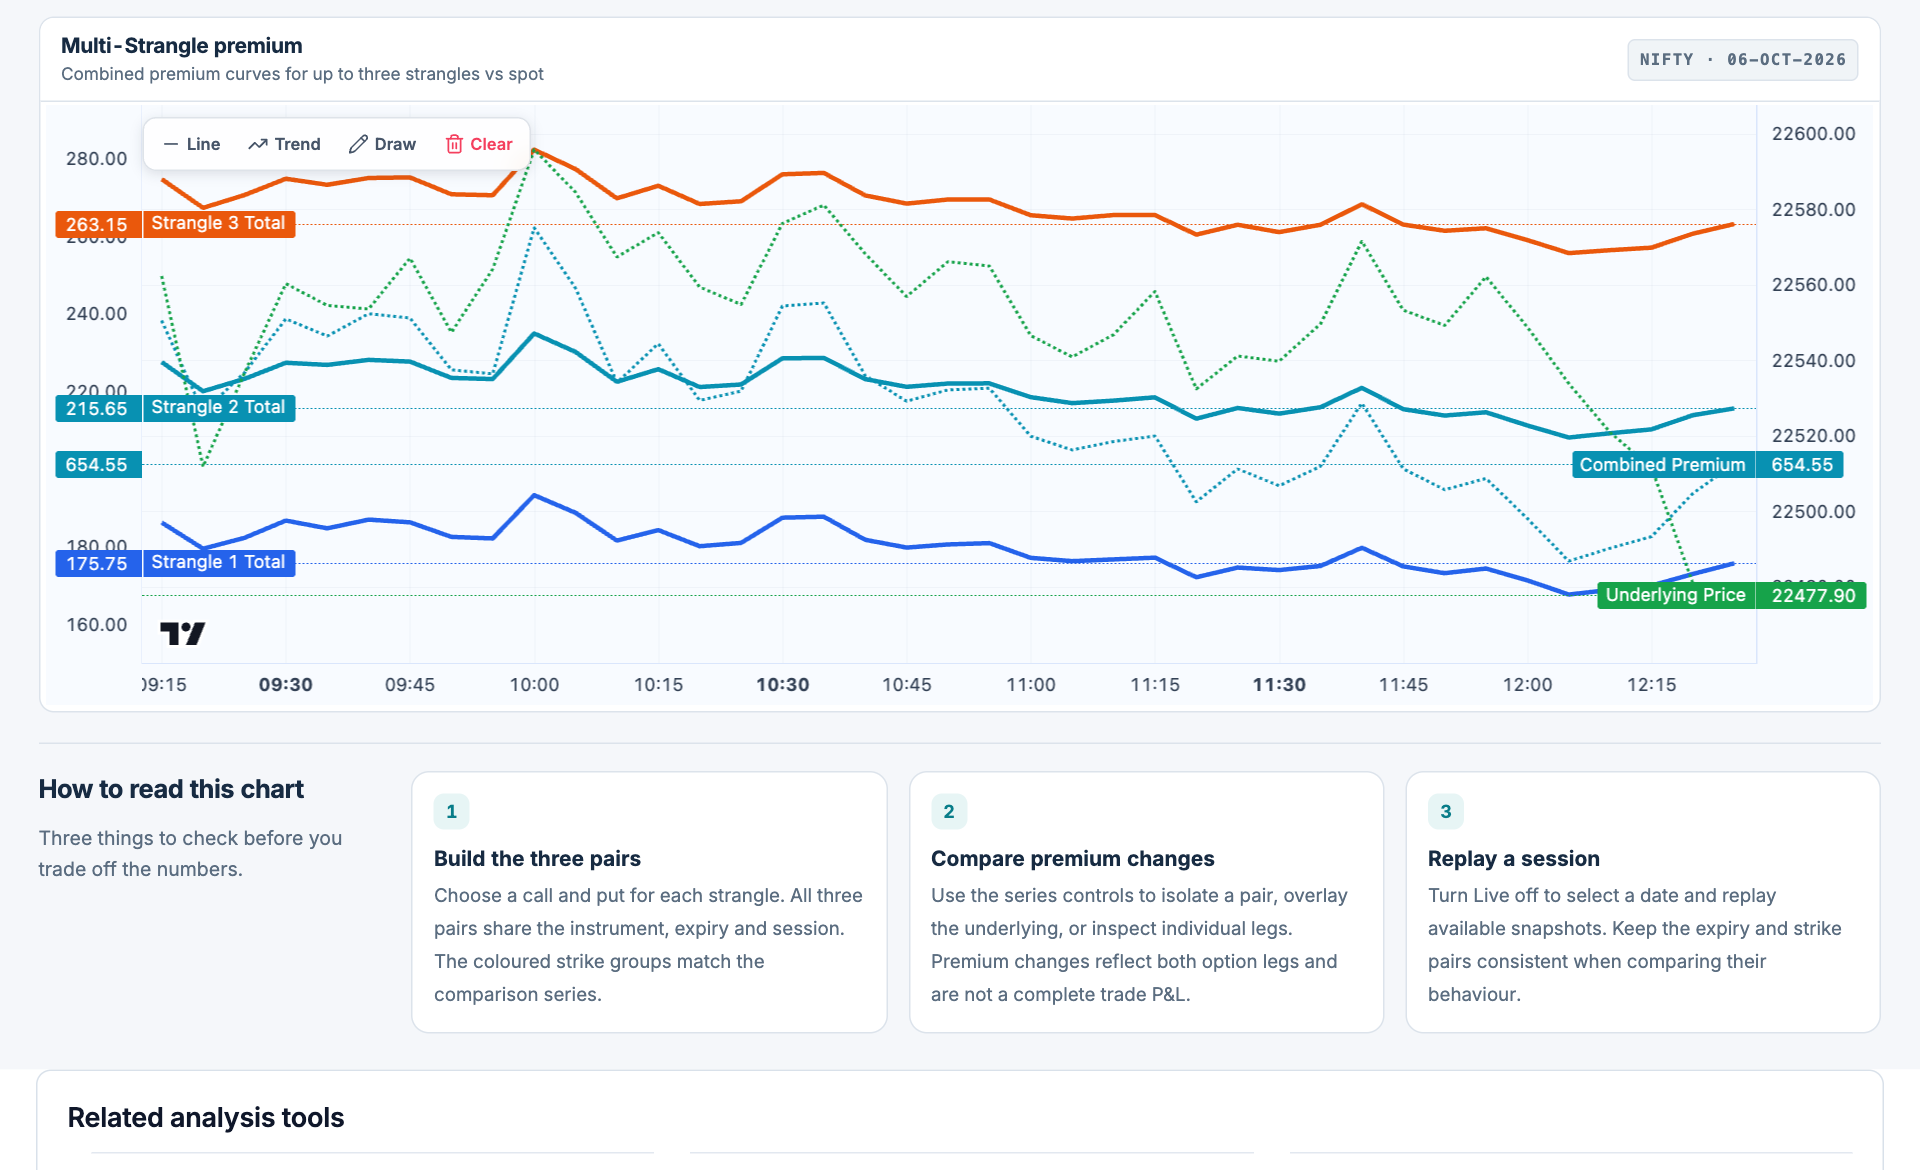
- Three pair totals. The labeled lines describe separate call-plus-put pairs. Each has its own chosen strikes.
- Combined premium. The combined total uses a separate scale. Check the legend before comparing heights.
- Underlying price. The underlying provides context on a different axis; it is not another option premium.
- Contract scope. All displayed pairs in this example share the selected instrument and expiry.
Compare three strike choices
- Choose the underlying, expiry and session once for the workspace.
- Configure a call strike and put strike for the first pair. Record their distance from the underlying.
- Add the second and third pairs with a deliberate change in strike spacing.
- Use the series controls to isolate each total or inspect its individual legs. Read underlying price on its own axis.
- Replay a historical session if available, keeping all pairs on the same observation time.
Worked example: reconstruct the total
Three illustrative pairs have premiums of 80, 100 and 130 points. Their displayed combined premium is 310 points. If the first pair falls to 70 while the others are unchanged, the combined reading falls to 300. That does not identify a 10-point portfolio profit without position actions and quantities.
Keep strike spacing and liquidity visible
Wider strikes often have smaller premiums but can be less liquid. Do not compare a stale far-wing print with a recent ATM quote as if they were synchronized. Use the strangle versus straddle guide for structure definitions.