
Access and workspace scope
The learning guide is public. The full Strategy Builder workspace requires sign-in and an eligible membership. Its ready-made structures, position editor, payoff, Greeks, simulator and backtest views answer different questions; access or available history can vary.
Start with a model or ready-made structure when learning. Saving a draft, deploying a strategy and initiating trade actions are separate controls. Reading this guide does not authorize any transaction.
Screenshot: opening the Strategy Builder
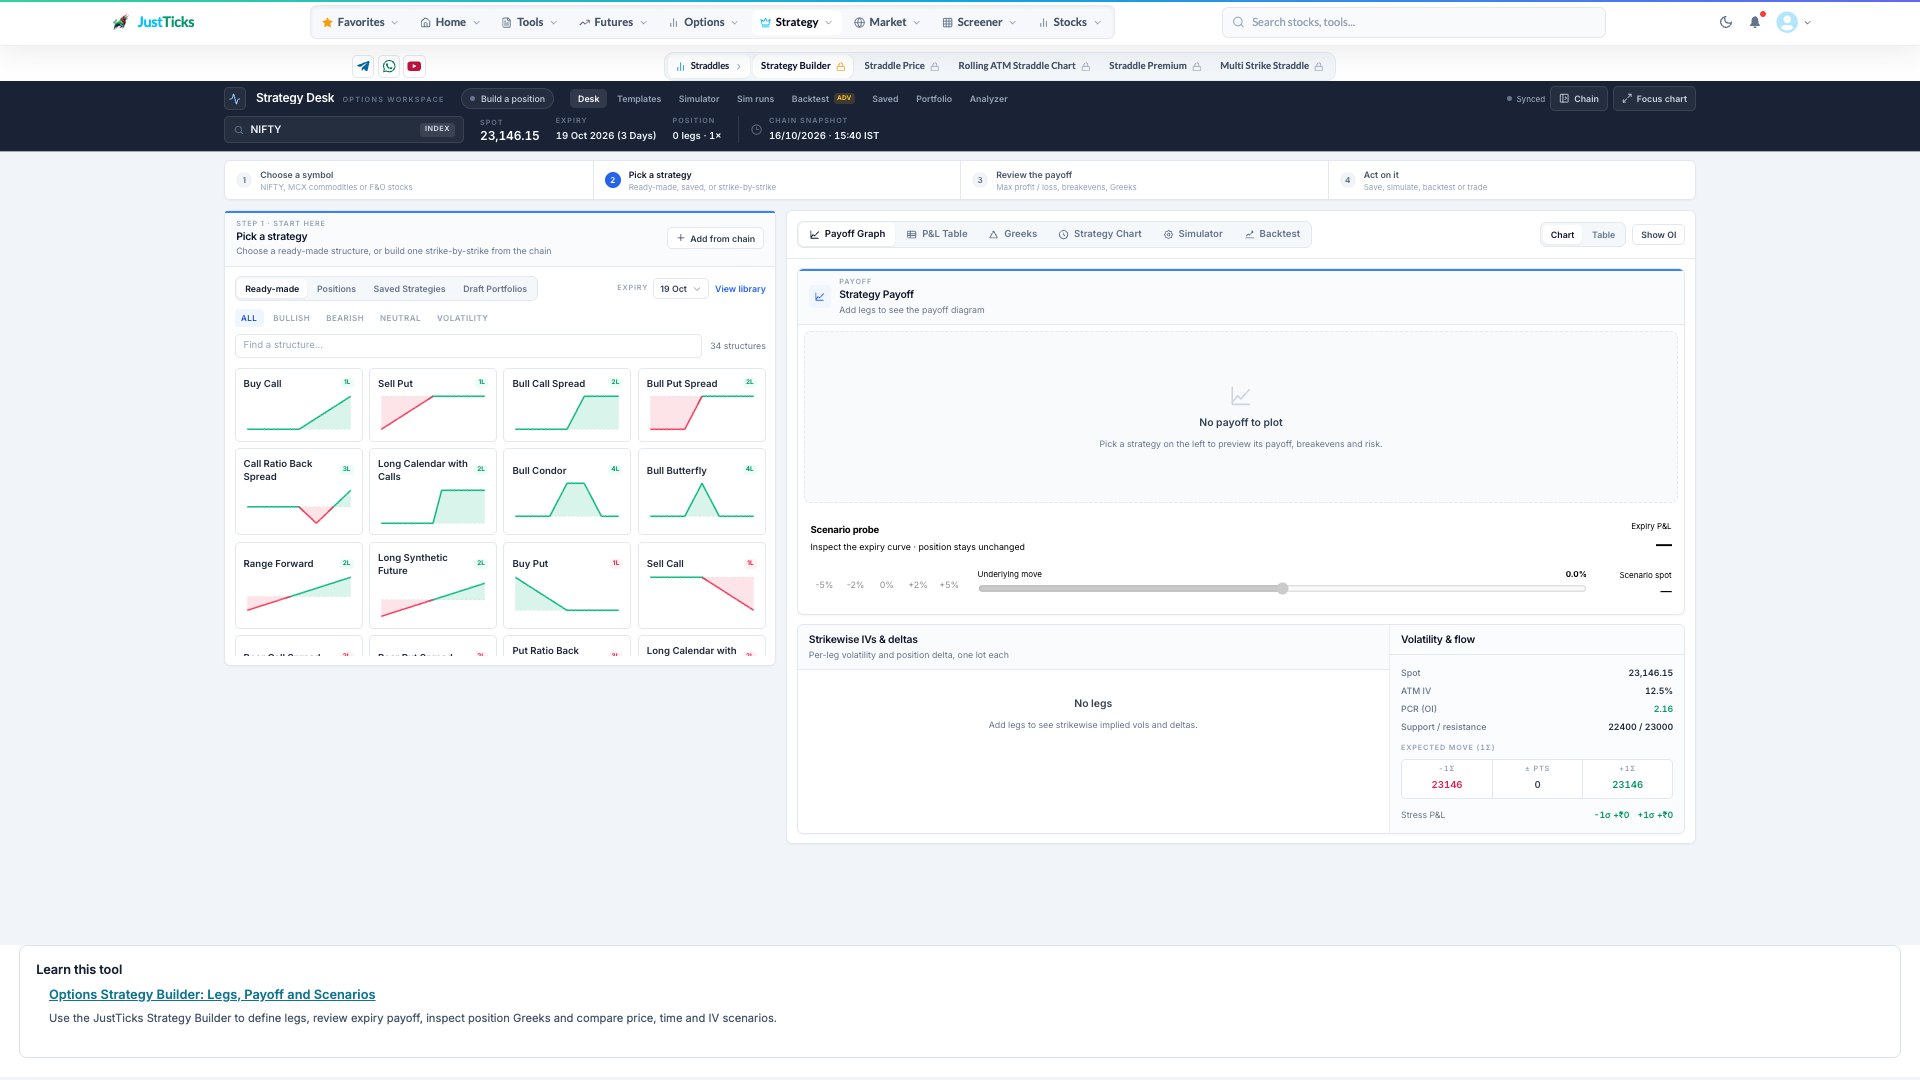
- Instrument and snapshot. Confirm the underlying, expiry and available chain timestamp.
- Ready-made structures. A template defines option legs; entry premiums and quantities still determine its risk.
- Payoff workspace. Add a structure to populate the graph. This capture is an empty documentation workspace with no saved positions.
- Scenario probe. Price, time and IV scenarios are modeled sensitivities, not predicted market outcomes.
Define the position before reading the graph
- Choose the underlying and a ready-made structure or add individual legs from the chain.
- For every leg confirm option type, strike, expiry, buy or sell action, quantity and entry premium.
- Read Payoff Graph at the stated valuation or expiry time. Use the P&L Table to verify specific underlying prices.
- Open Greeks to inspect the net position sensitivity. Quantities and long or short actions change the total.
- Use Simulator to vary price, IV and time assumptions. A pre-expiry scenario is different from the final expiry payoff.
- If using Backtest, verify the historical contract rules, dates and available data. Use Save draft only when you intend to keep a model; trade actions are separate.
Worked example: a debit call spread
Suppose you buy a 25,000 call for 100 and sell a 25,100 call for 60 in the same expiry and equal quantity. The net debit is 40 points, the strike width is 100 and the maximum expiry profit is 60 points before costs. The expiry breakeven is 25,040.
A plotted pre-expiry value can differ because both legs still have time value and IV exposure. Multiply point results by the applicable quantity to express a currency amount; margin requirements are a separate issue.
Model outputs and real execution
Pricing assumptions, stale quotes, missing history and execution costs affect comparisons. A favorable scenario is not a forecast, and a backtest is limited by its data and contract assumptions. For structure definitions read the strategy learning path.