
Observed decay versus modeled theta
Theta estimates sensitivity to the passage of time while other pricing inputs are held fixed. The market premium changes with several inputs at once. That is why a premium can rise while time passes, and why a large observed fall cannot be attributed to theta alone.
Keep expiry, strike range and session consistent when comparing call and put readings. Diagnostic labels organize the data; they do not establish whether the people holding a position are profitable.
Screenshot: timeline and diagnostics
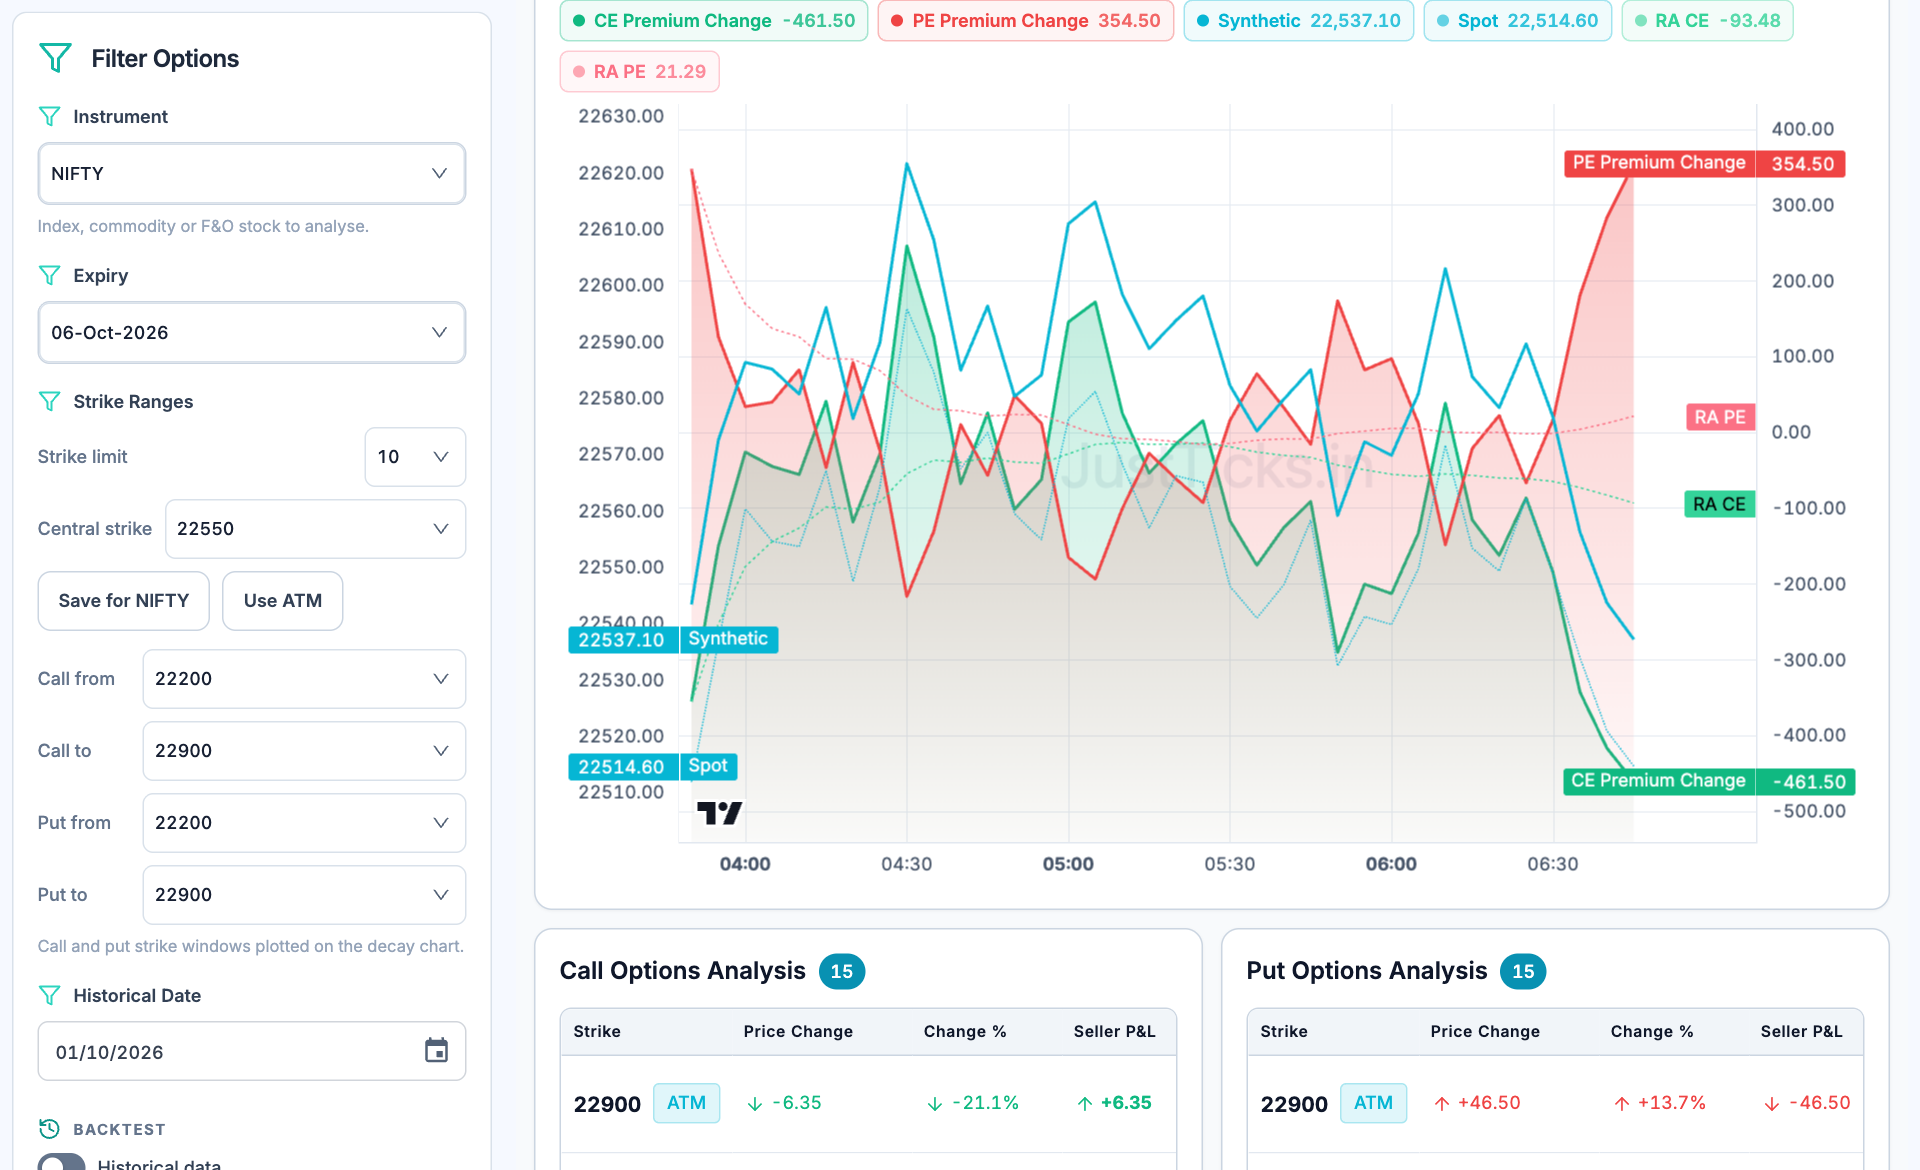
- Expiry. Use the same expiry and observation time when comparing call and put changes.
- Strike windows. Call and put ranges can be set independently; unequal coverage changes the aggregate.
- Observed price changes. The chart combines price, IV and time effects. This is not an isolated theta estimate.
- Strike diagnostics. Inspect the supporting call and put rows to identify which contracts explain a total.
Use the decay workspace
- Select instrument, expiry, session and a comparable strike window.
- Read the premium timeline before opening additional diagnostic tabs.
- Compare the buyer and seller views as different perspectives on the same covered price inputs.
- Use the structure, volatility, flow and risk diagnostics to investigate a change; they are contextual measurements rather than independent forecasts.
- Verify the strike detail table and data time. Compare another session only after matching time to expiry and moneyness.
Worked example: price change is not a theta estimate
An illustrative option premium falls from 100 to 90 points over an hour. A displayed theta estimate of minus 5 points per day does not explain that 10-point fall on its own. The underlying could have moved, IV could have fallen or a previous print could have been stale.
For a whole long or short combination, use the strategy workspace and include every leg, entry premium and quantity rather than interpreting a single-contract timeline as portfolio P&L.
What an apparent decay advantage can hide
Spreads, stale prices and different strike selections can exaggerate comparisons. Time decay is nonlinear and changes as expiry approaches. An observed pattern in one session is not a guaranteed daily return.