
Filter from different signal families
Three momentum filters that all use the same closing prices tell you almost the same thing three times. Better scans combine filters that measure different things:
| Family | Example | Question it answers |
|---|---|---|
| Momentum | RSI | Is price moving strongly, and is it stretched? |
| Trend direction | MACD, moving averages | Which way is the trend, and did it just turn? |
| Trend strength | ADX | Is there a trend at all, or is the market ranging? |
| Participation | Volume, relative volume | Is real activity confirming the move? |
| Price structure | Distance from a high or low | Where is price relative to key levels? |
How to use the Custom Screener
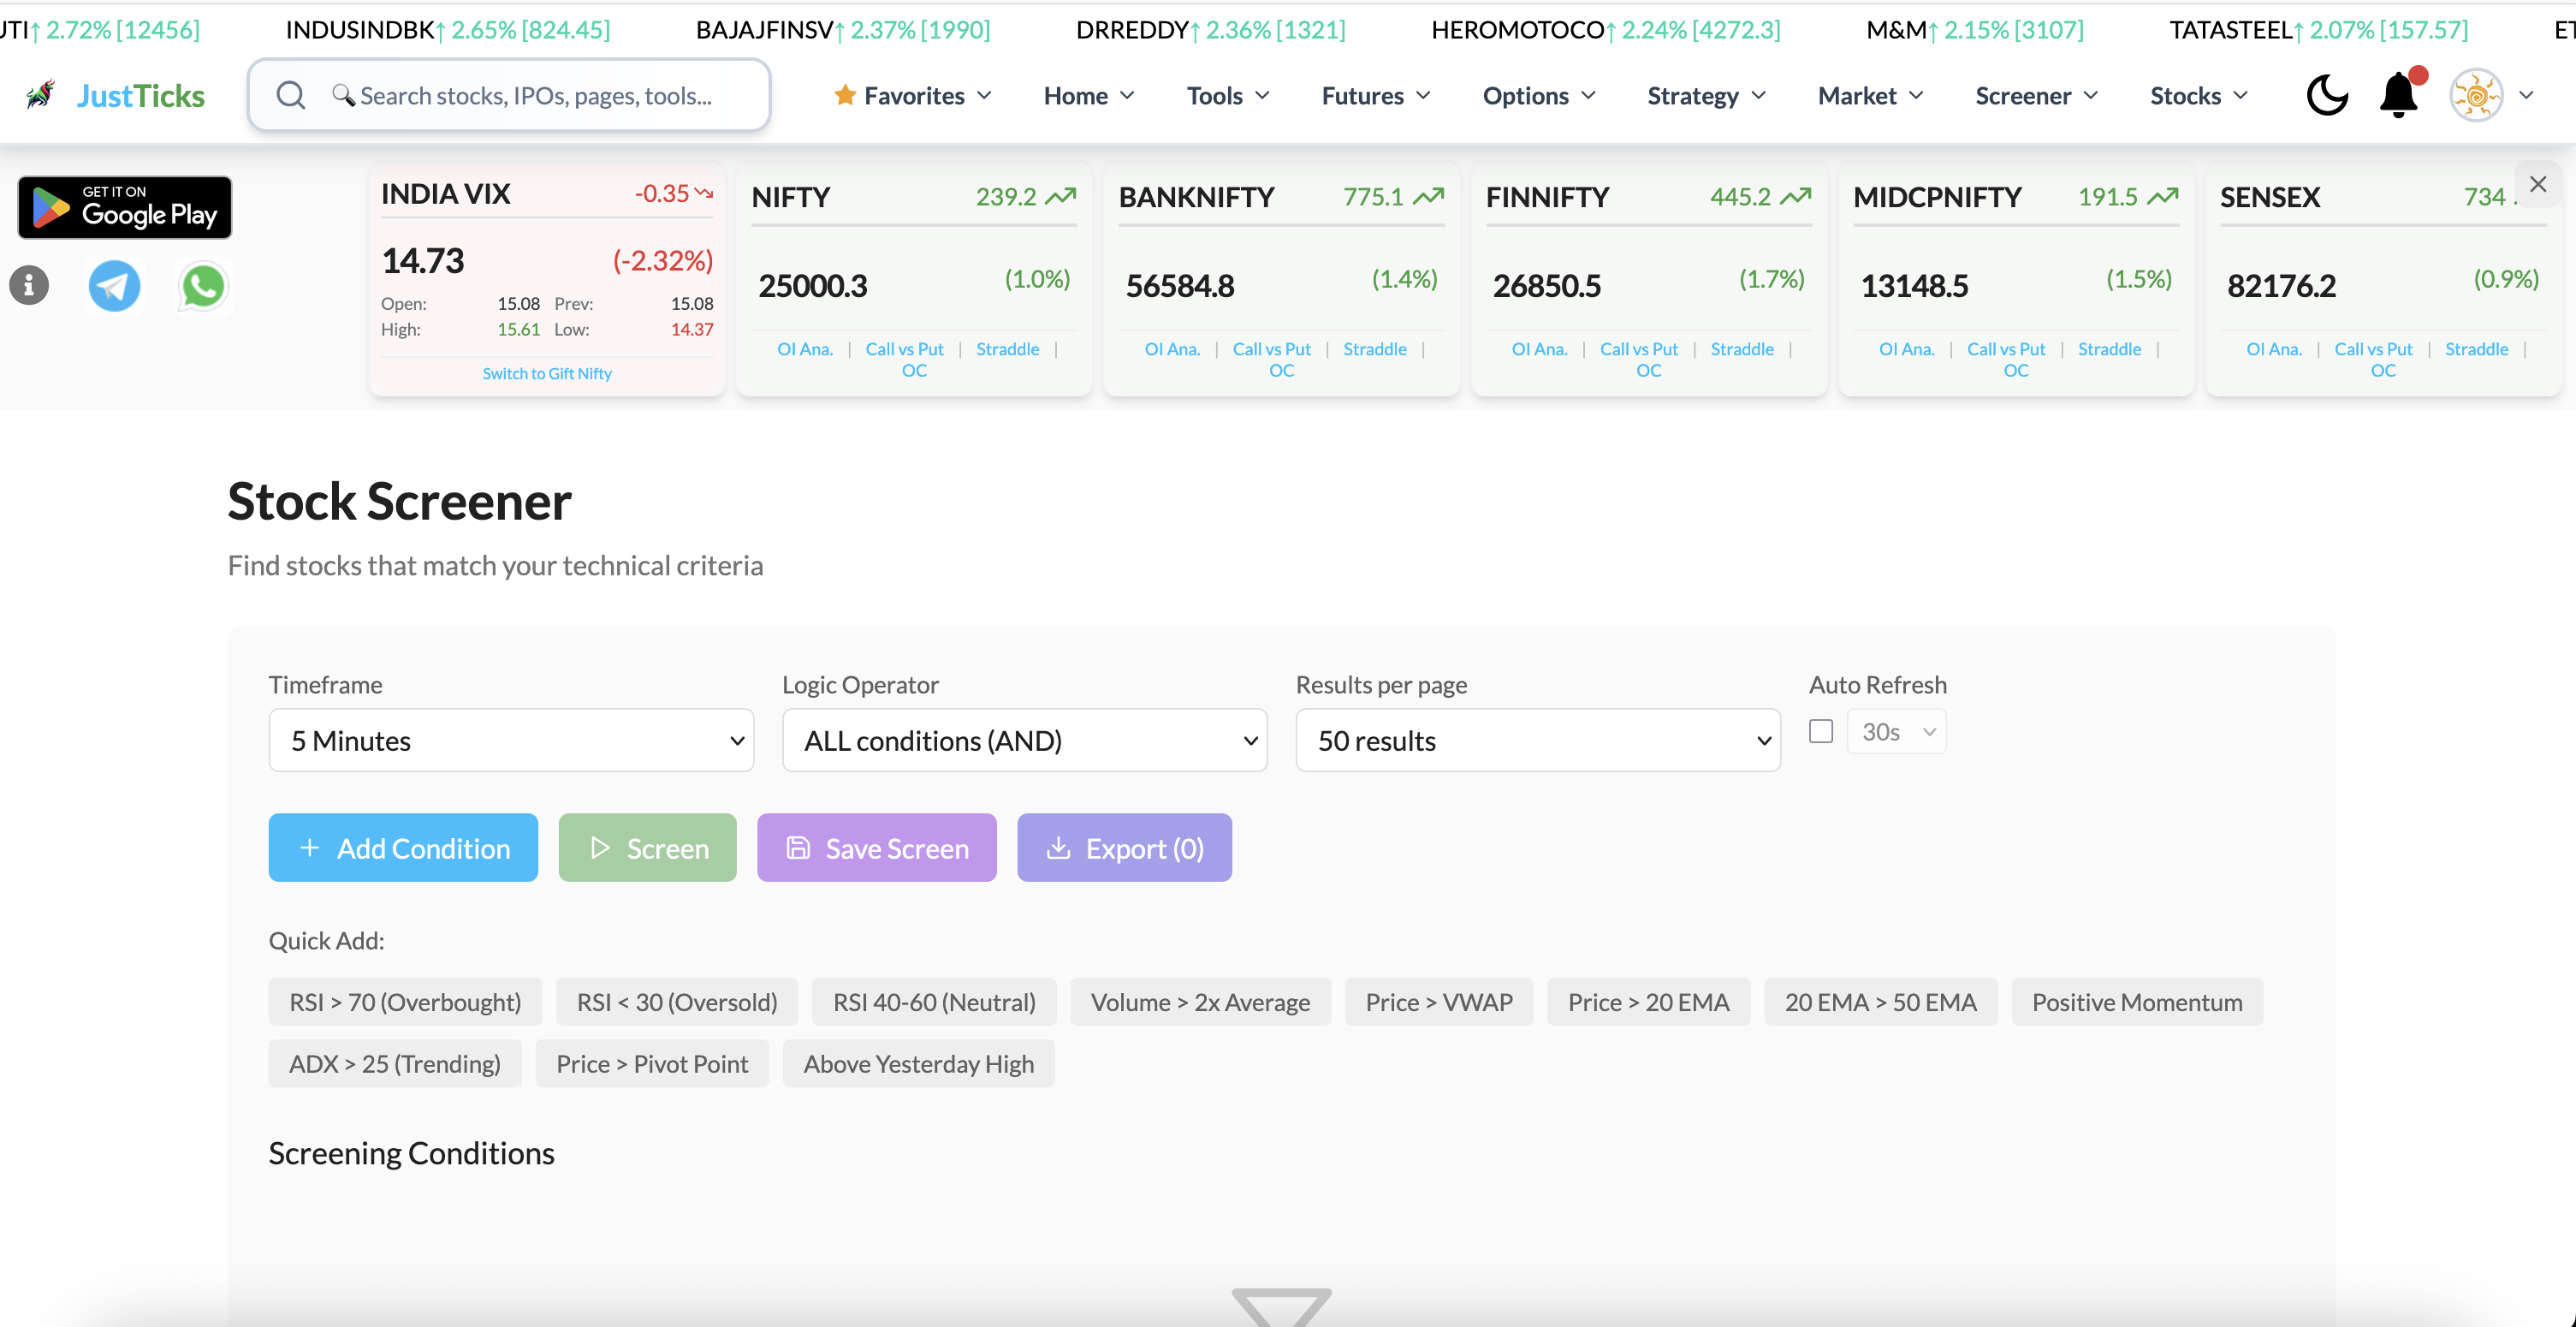
- Choose the interval. Conditions are evaluated on the selected candle timeframe.
- Choose the logic. AND requires every condition; OR accepts any selected condition.
- Build conditions. Add Condition and Quick Add create editable rules rather than entering an order.
- Save a reusable screen. Saving preserves the filter definition; the results still depend on the selected market snapshot.
- Open the Technical Screener and choose the timeframe and universe.
- Add a small set of conditions or start with a Quick Add rule.
- Choose AND when all conditions are required, or OR when any one condition may match.
- Run Screen and inspect the condition values on each result, including missing fields and update times.
- Save a named filter for reuse. Export describes that scan output; it is not a historical trading simulation.
Three example scans
Fresh momentum
RSI + MACDRSI in a mid-to-high band (momentum present, not exhausted) with a new MACD bullish crossover. Finds trends that are just starting.
Trending with strength
ADX + MAADX above a trend threshold with price above its 20 and 50 period averages. Finds established trends rather than sideways noise.
Pullback in an uptrend
MA + RSIPrice above the 50-period average, RSI cooled from overbought, volume drying up on the dip. Finds orderly pullbacks.
Thresholds above are starting points, not rules. Adjust them per timeframe and check how the same scan would have performed on past sessions.
A screening workflow
- State the setup in words first, such as "uptrend, cooling momentum, rising volume", then translate each phrase into one filter.
- Choose one timeframe for all filters so they describe the same candles.
- Add filters one at a time and watch the result count; a scan that returns zero or hundreds of stocks needs adjusting.
- Add a liquidity filter so illiquid names do not dominate.
- Review every match on its chart before acting; the screener narrows the list, you decide.
A worked example
Start with an idea: a young uptrend with room left. Translate it one filter at a time on the daily timeframe and watch the list shrink:
- RSI between 55 and 70: momentum present but not stretched.
- Add a bullish MACD crossover within the last two bars: the trend just turned.
- Add ADX above 20: confirms a trend exists.
- Add volume above 1.5x its 20-day average: participation.
- Add price above the 50-period moving average: trend direction.
If the list is empty, loosen the newest filter; if it is long, add a filter from a family not yet used. Then open the charts.
Illustrative numbers for a hypothetical stock, not a recommendation or a past trade.
Screening mistakes
- Redundant filters. Stacking similar indicators shrinks the list without adding evidence.
- Over-fitting. Thresholds tuned until a past period looks perfect rarely hold on new data.
- Unfinished candles. A signal that exists mid-candle can vanish at the close; check whether the scan uses completed bars.
- Ignoring the market. A bullish scan in a falling index produces more failures.