
What the pattern means
Open = High
Bearish biasPrice never traded above its opening print. Every attempt to rise was sold, which suggests supply at the open and that buyers failed to take control.
Open = Low
Bullish biasPrice never traded below its opening print. Every dip was bought, which suggests demand from the first trade.
The pattern is only meaningful while it holds. The instant price trades above the open on an Open = High stock, it is no longer an Open = High stock; the screener therefore shows a live, changing list through the session.
How to use the Open = High / Open = Low Screener
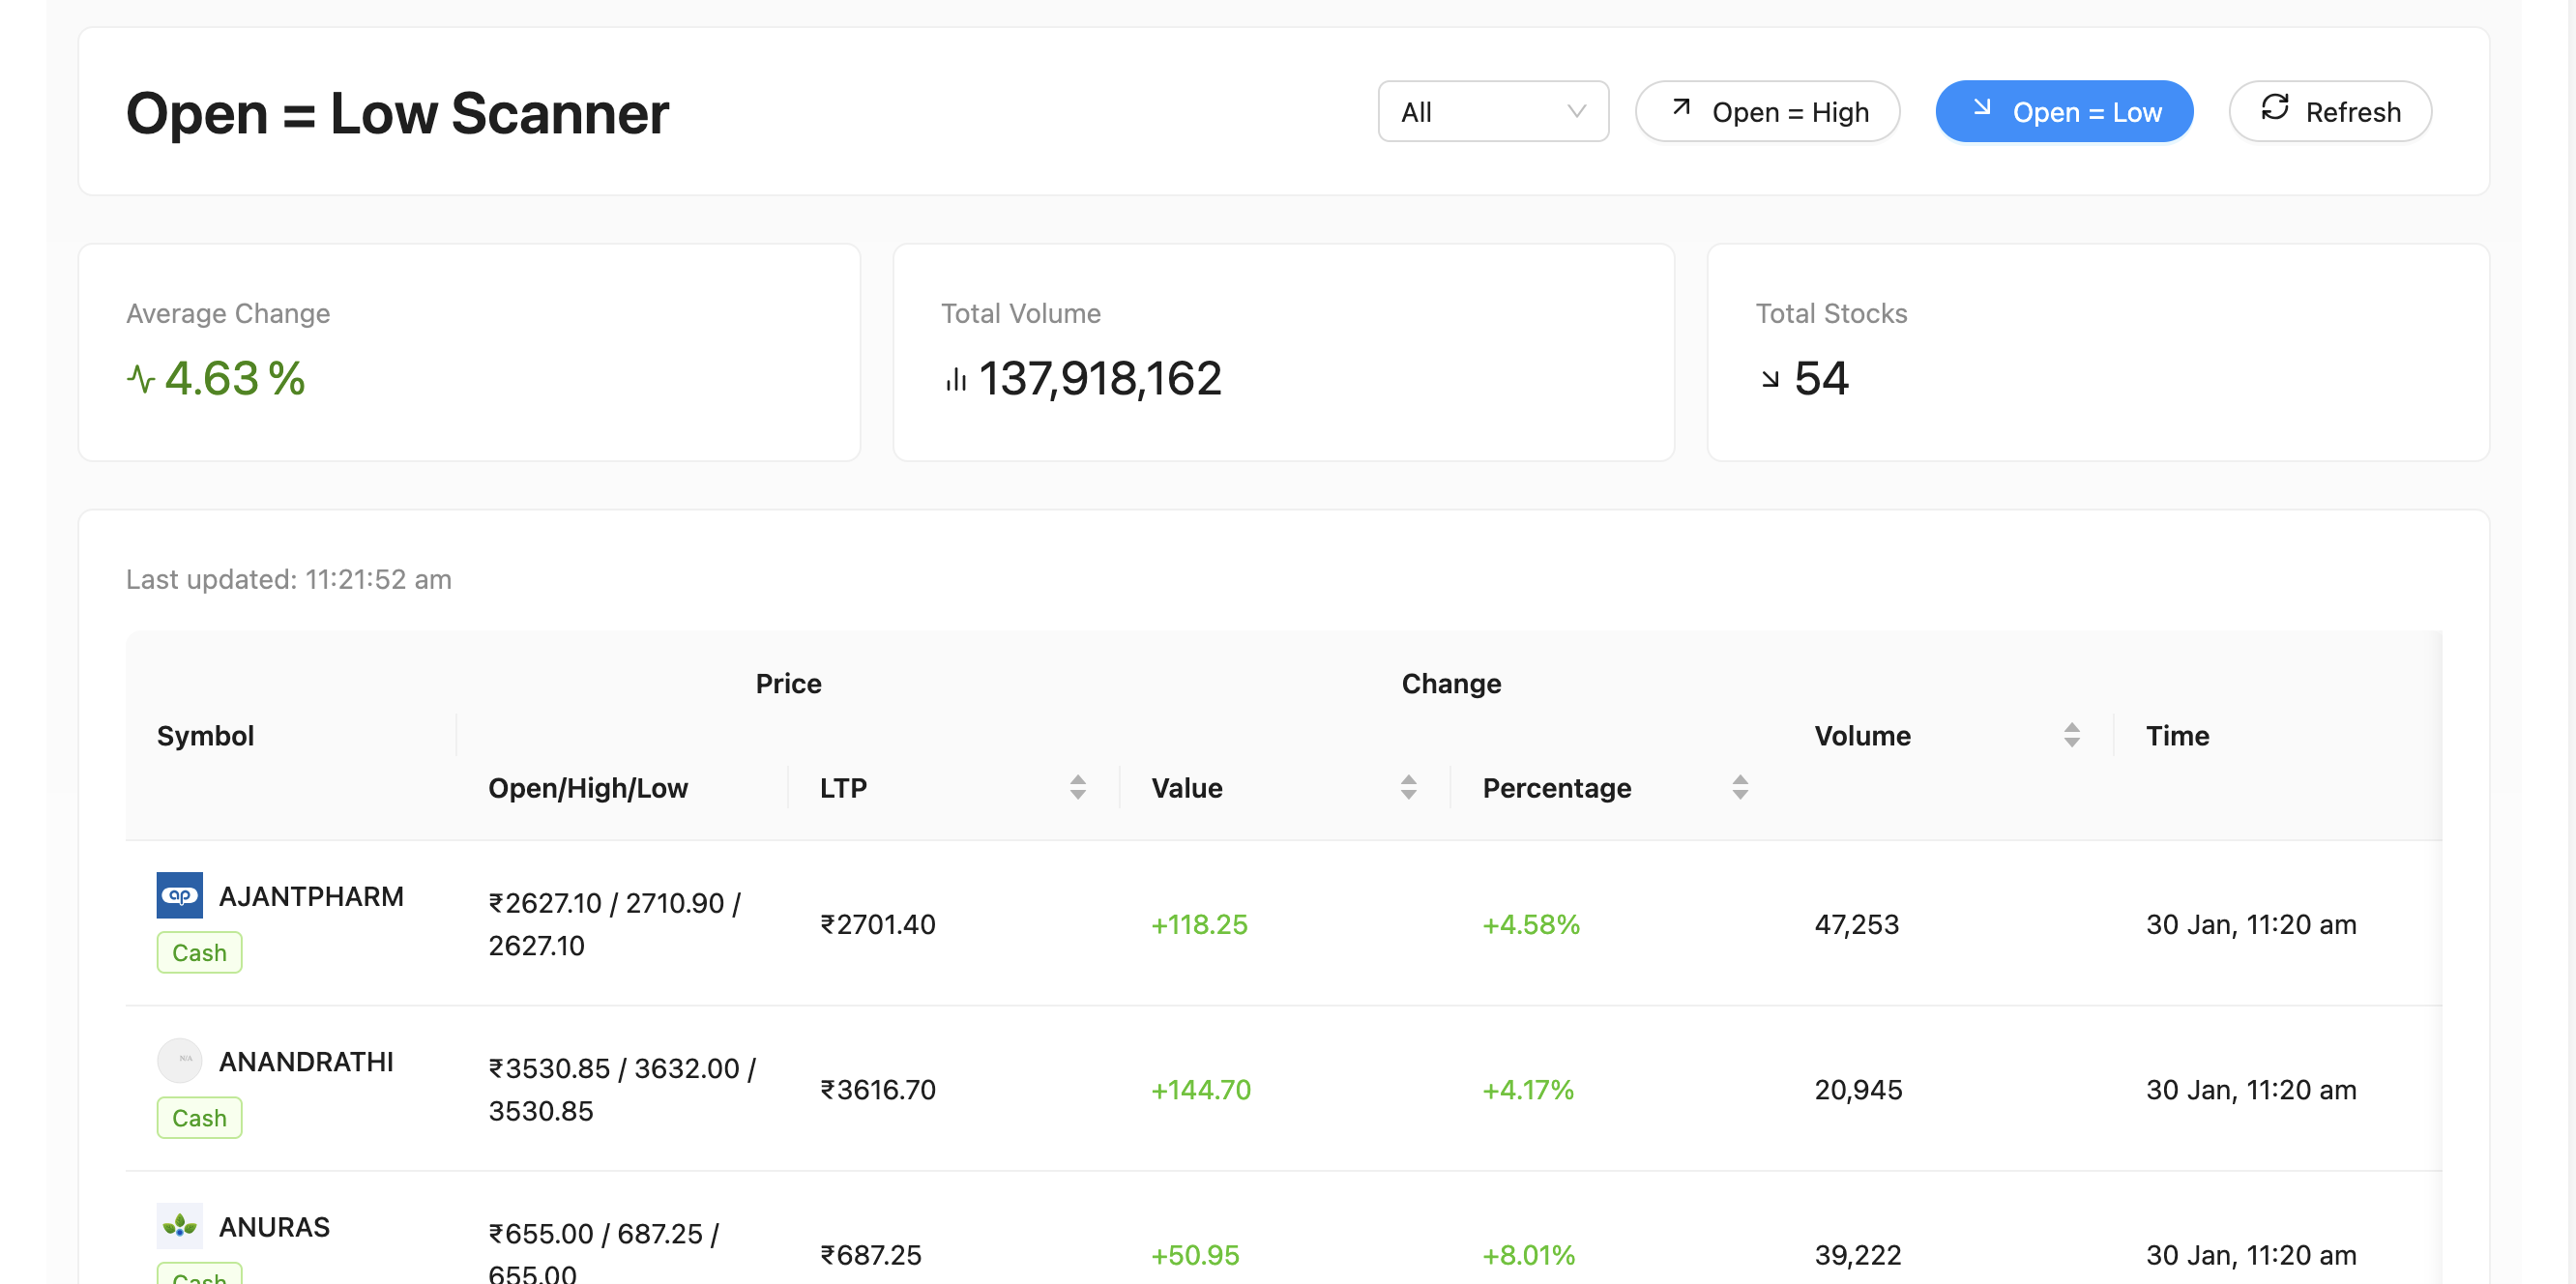
- Choose the opening condition. Open = High and Open = Low filter opposite opening-price relationships.
- Limit the segment. Use a consistent universe when comparing the summary cards.
- Verify equality. Read the actual open, high and low values instead of inferring the condition from price change.
- Check the update time. The opening condition is observed as of the displayed snapshot and can change later.
- Open Open = High / Open = Low and select the market segment.
- Choose the opening condition you want to inspect.
- Read the row open, high, low and last price to verify what the equality refers to.
- Check the snapshot time and volume; an opening extreme can be revisited later.
- Use ORB Breakout to inspect a range break separately from this equality scan.
How to use it
- Wait for the first 15 to 30 minutes. A stock with Open = High after a few minutes proves little; after half an hour it shows persistent selling.
- Prefer a gap in the same direction. A gap-up that opens at the high and fades, or a gap-down that opens at the low and recovers, shows aggressive reversal.
- Look for volume. The pattern backed by above-average volume carries more weight than a quiet drift.
- Set invalidation at the open. For Open = High shorts, a move above the open ends the setup. Keep the stop at or just above that price.
- Cross-check the index. A stock selling while the index rises is weaker; a stock holding its open-low while the index falls is stronger.
A worked example
XYZ closed at 800 yesterday and gaps up to 820. By 9:45 its high is still 820 and it trades at 812 on above-average volume. The bias is bearish while price stays under 820.
Entry short at 812, stop 821 just above the open (risk 9), target the gap fill at 800 (reward 12): about 1.3R. A move above 820 removes the pattern and the trade with it.
Illustrative numbers for a hypothetical stock, not a recommendation or a past trade.
Limits
- It is a bias, not an entry. Pair it with a level, such as the previous day's high or low or VWAP.
- Early in the session the list is noisy. Many stocks qualify in the first minutes and then drop out.
- Illiquid stocks can show the pattern because of few trades, not because of real selling or buying.