
What a candlestick pattern tells you
Each candle records the open, high, low and close of a period. Patterns such as an engulfing candle, a hammer or a doji describe how the contest between buyers and sellers changed from one candle to the next. A bullish engulfing candle, for instance, shows buyers overpowering the previous candle's sellers.
The pattern describes the shift, not the outcome. Whether it matters depends on where it appears.
How to use the Indicators & Patterns screener
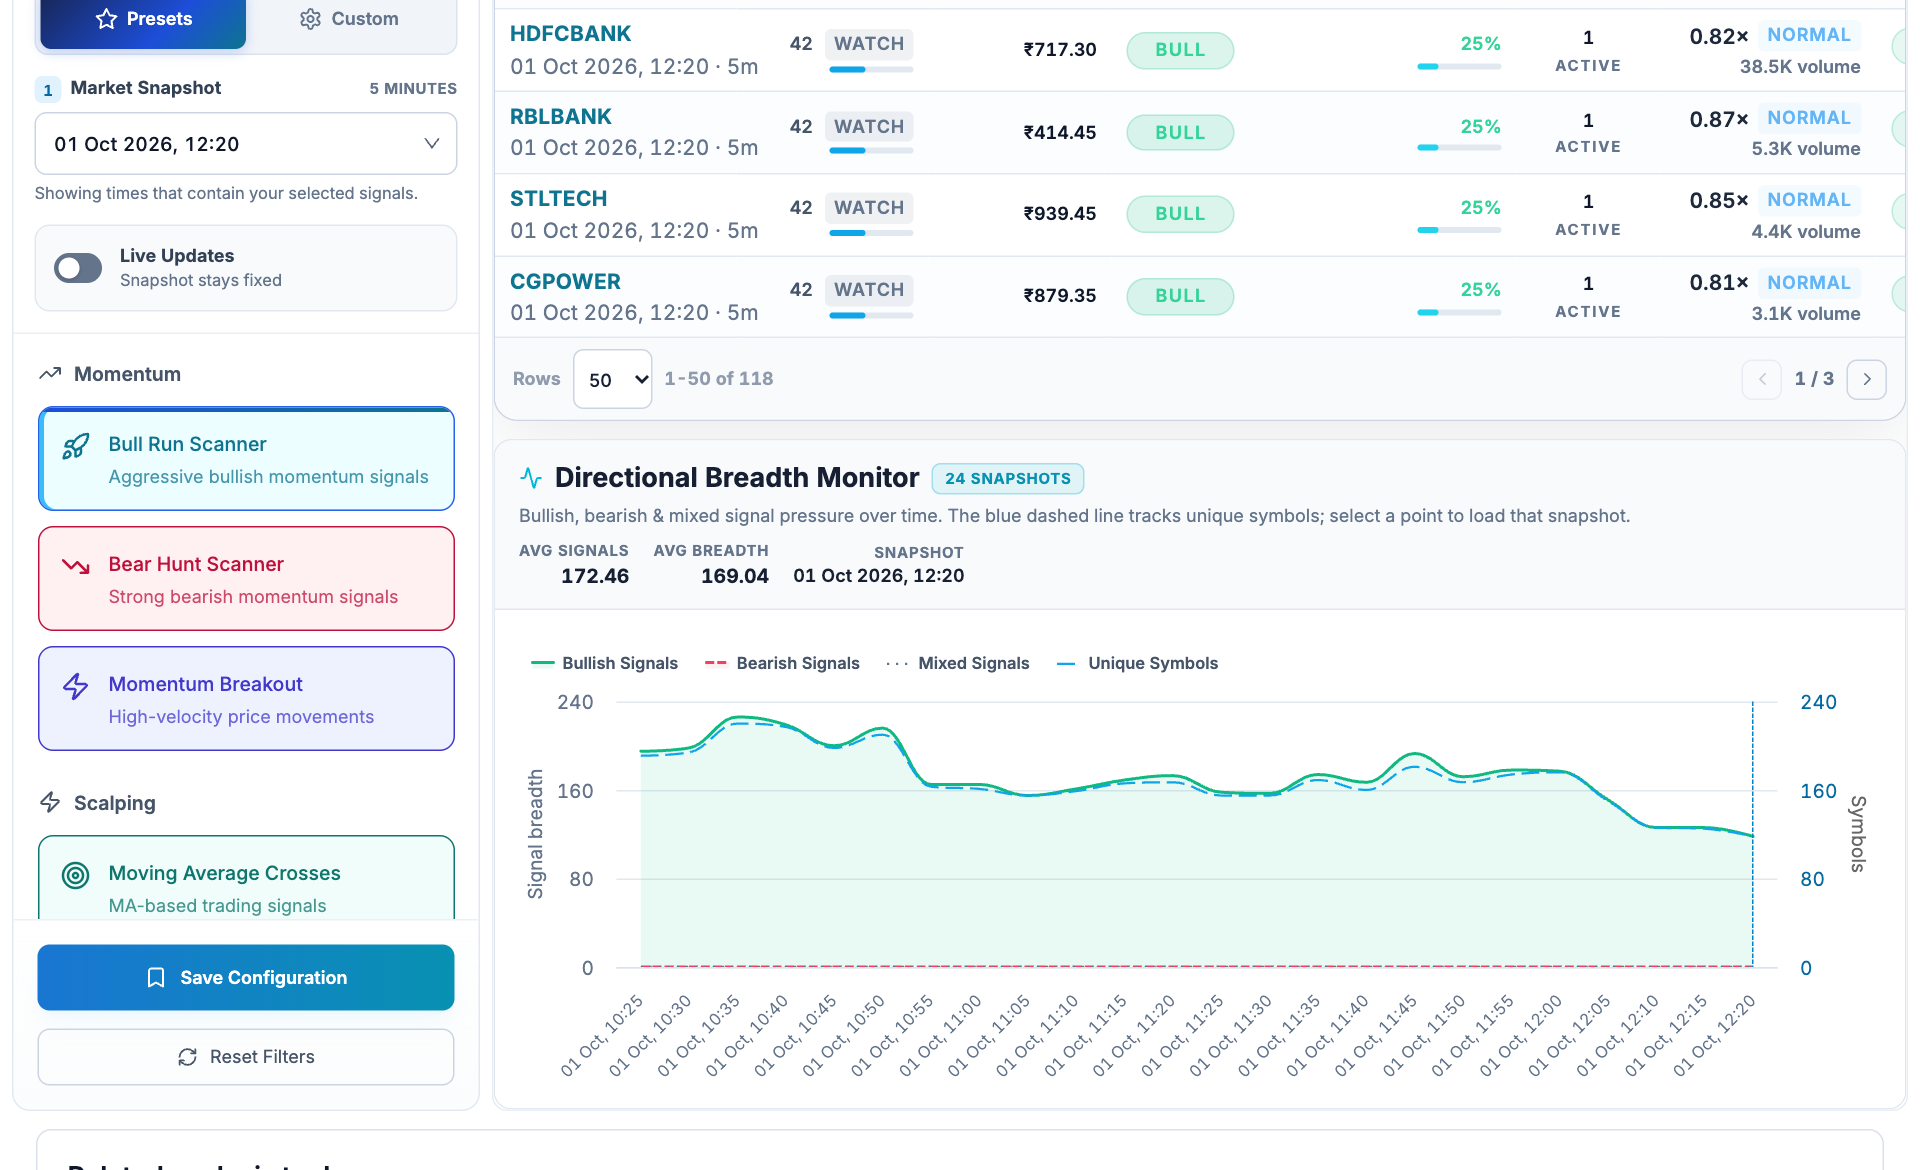
- Freeze the snapshot. The selected market time fixes the pattern results being reviewed.
- Choose a preset. Bull Run and Bear Hunt represent different condition groups.
- Read participation. Relative volume compares participation with a baseline; direction comes from separate conditions.
- Inspect breadth over time. The chart separates signal counts from the number of unique symbols.
- Open the Technical Pattern Screener, choose timeframe and segment, then pick a market snapshot.
- Start with one preset or select the specific pattern family you want to examine.
- Read each row timestamp, direction, active conditions and relative volume.
- Use the directional breadth chart to distinguish many conditions on a few symbols from broad participation.
- Open the individual chart before interpreting a candlestick label; trend and the nearby level determine its context.
Context matters more than the name
| Check | Stronger signal | Weaker signal |
|---|---|---|
| Location | At a prior support or resistance | In the middle of a range |
| Trend | Reversal pattern after an extended move | Reversal pattern in a flat market |
| Volume | Above the stock's average | Below average |
| Timeframe | Daily or hourly | 1-minute noise |
| Confirmation | Next candle follows through | Next candle reverses it |
Why confluence and relative volume help ranking
When several independent conditions line up on the same stock and candle, such as a pattern, a trend filter and a volume expansion, the case is stronger than any one alone. A ranked screener scores that agreement so you review the highest-agreement names first.
A score describes how many of the screener's rules agree. It is not a probability of success, and conditions built from the same price history can overlap instead of confirming each other.
A worked example
XYZ falls into the 450 area, where it held twice before. A bullish engulfing candle forms at 451 on 1.8x average volume. The next candle closes above the engulfing candle's high, confirming it. The stop goes below the engulfing low at 443.
The same engulfing candle in the middle of a range, on average volume, with nothing nearby to mark support, would deserve far less attention. The pattern is identical; the context is not.
Illustrative numbers for a hypothetical stock, not a recommendation or a past trade.
Review routine
- Choose the timeframe you actually trade.
- Take the top of the ranked list, not every match.
- Open the chart and mark the nearest support and resistance.
- Confirm volume and wait for the next candle if the pattern is a reversal.
- Define the stop at the pattern's extreme and compare it with the distance to the next level.