
Volume, delivery volume and delivery percentage
Traded volume
All tradesTotal shares bought and sold in the session, including intraday trades that were squared off the same day.
Delivery volume
Settled sharesShares that were actually delivered into demat accounts, meaning positions carried past the day.
Delivery %
RatioDelivery volume divided by traded volume. A high figure means most trading was by holders, not intraday speculators.
NSE publishes delivery data after the market closes, so delivery measures are end-of-day, not live.
Screenshot: controls and readings
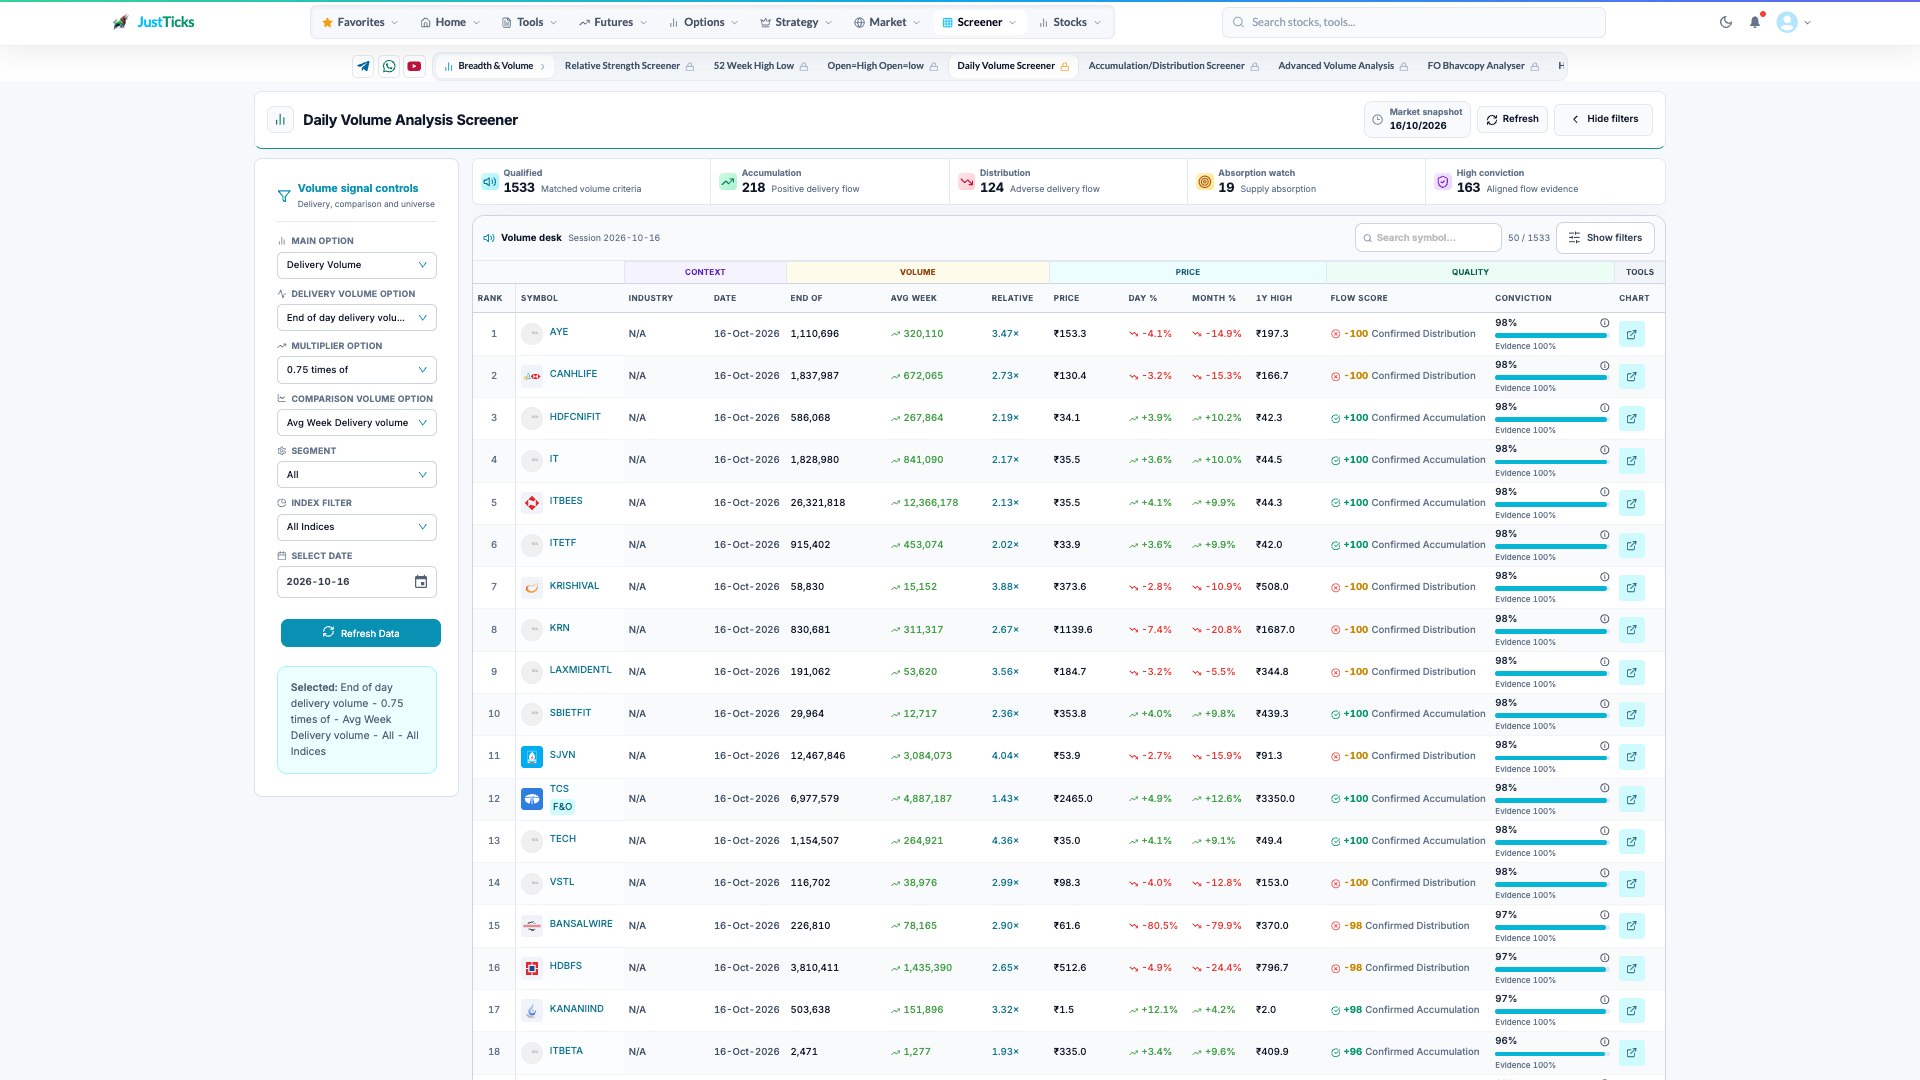
- Main measure. Select traded volume, delivered volume or delivery percentage before choosing the comparison.
- Observation measure. Match the end-of-day or historical measure to the baseline you want to compare.
- Multiplier. The multiplier is a screening threshold rather than a conviction score.
- Comparison baseline. A weekly average and a previous-day value describe different baselines.
How to use the Daily Volume Screener
- Open the Daily Volume Screener, select the date, market universe and comparison period.
- Complete the required volume or delivery condition before running the scan.
- Read traded quantity, delivered quantity and delivery percentage separately.
- Compare the latest observation with its own historical average rather than comparing raw shares across stocks.
- Open a result chart and check whether unusual delivery coincided with a price rise, decline or flat session. Delivery does not identify the buyer.
Compare with the stock's own average
Delivery percentages differ widely between stocks, so a figure means little on its own. Compare today's volume and delivery with the stock's own weekly, monthly and six-month averages. A day with volume and delivery both well above average suggests real accumulation or distribution, depending on the price move.
| Price | Volume and delivery | Common reading |
|---|---|---|
| Rising | Both high versus average | Investor buying behind the move |
| Rising | Volume high, delivery low | Intraday speculation; weaker conviction |
| Falling | Both high versus average | Investor selling; possible distribution |
| Flat | Both high versus average | Absorption; a break may follow |
A worked example
XYZ's monthly average volume is 10 lakh shares with an average delivery of 45%, so about 4.5 lakh delivered shares a day. Today it trades 28 lakh (2.8x) with 62% delivery, which is 17.4 lakh delivered shares, about 3.9x its usual.
Price is up 2.5% on the day. Volume and delivery both well above average on a rising price is a common sign of investor buying behind the move. If delivery had stayed near 45% on the same volume, intraday activity would explain most of it.
Illustrative numbers for a hypothetical stock, not a recommendation or a past trade.
Limits
- Delivery does not show direction. Every delivered share has both a buyer and a seller.
- Hedged and arbitrage positions can create delivery without a view.
- Event days such as index rebalancing or bulk deals distort the figures.
- Single-day readings are noisy. Look for repeated high-delivery sessions.