
What relative strength is
Relative strength (RS) measures how a stock has performed compared with others, usually over several recent periods with more weight on the latest. An RS rating converts that into a rank, commonly from 1 to 99, where 90 means the stock has outperformed about 90% of the universe.
RS rating is not the RSI indicator. RSI measures a single stock's recent price changes against itself. RS rating compares the stock with all other stocks.
How to use the Relative Strength Screener
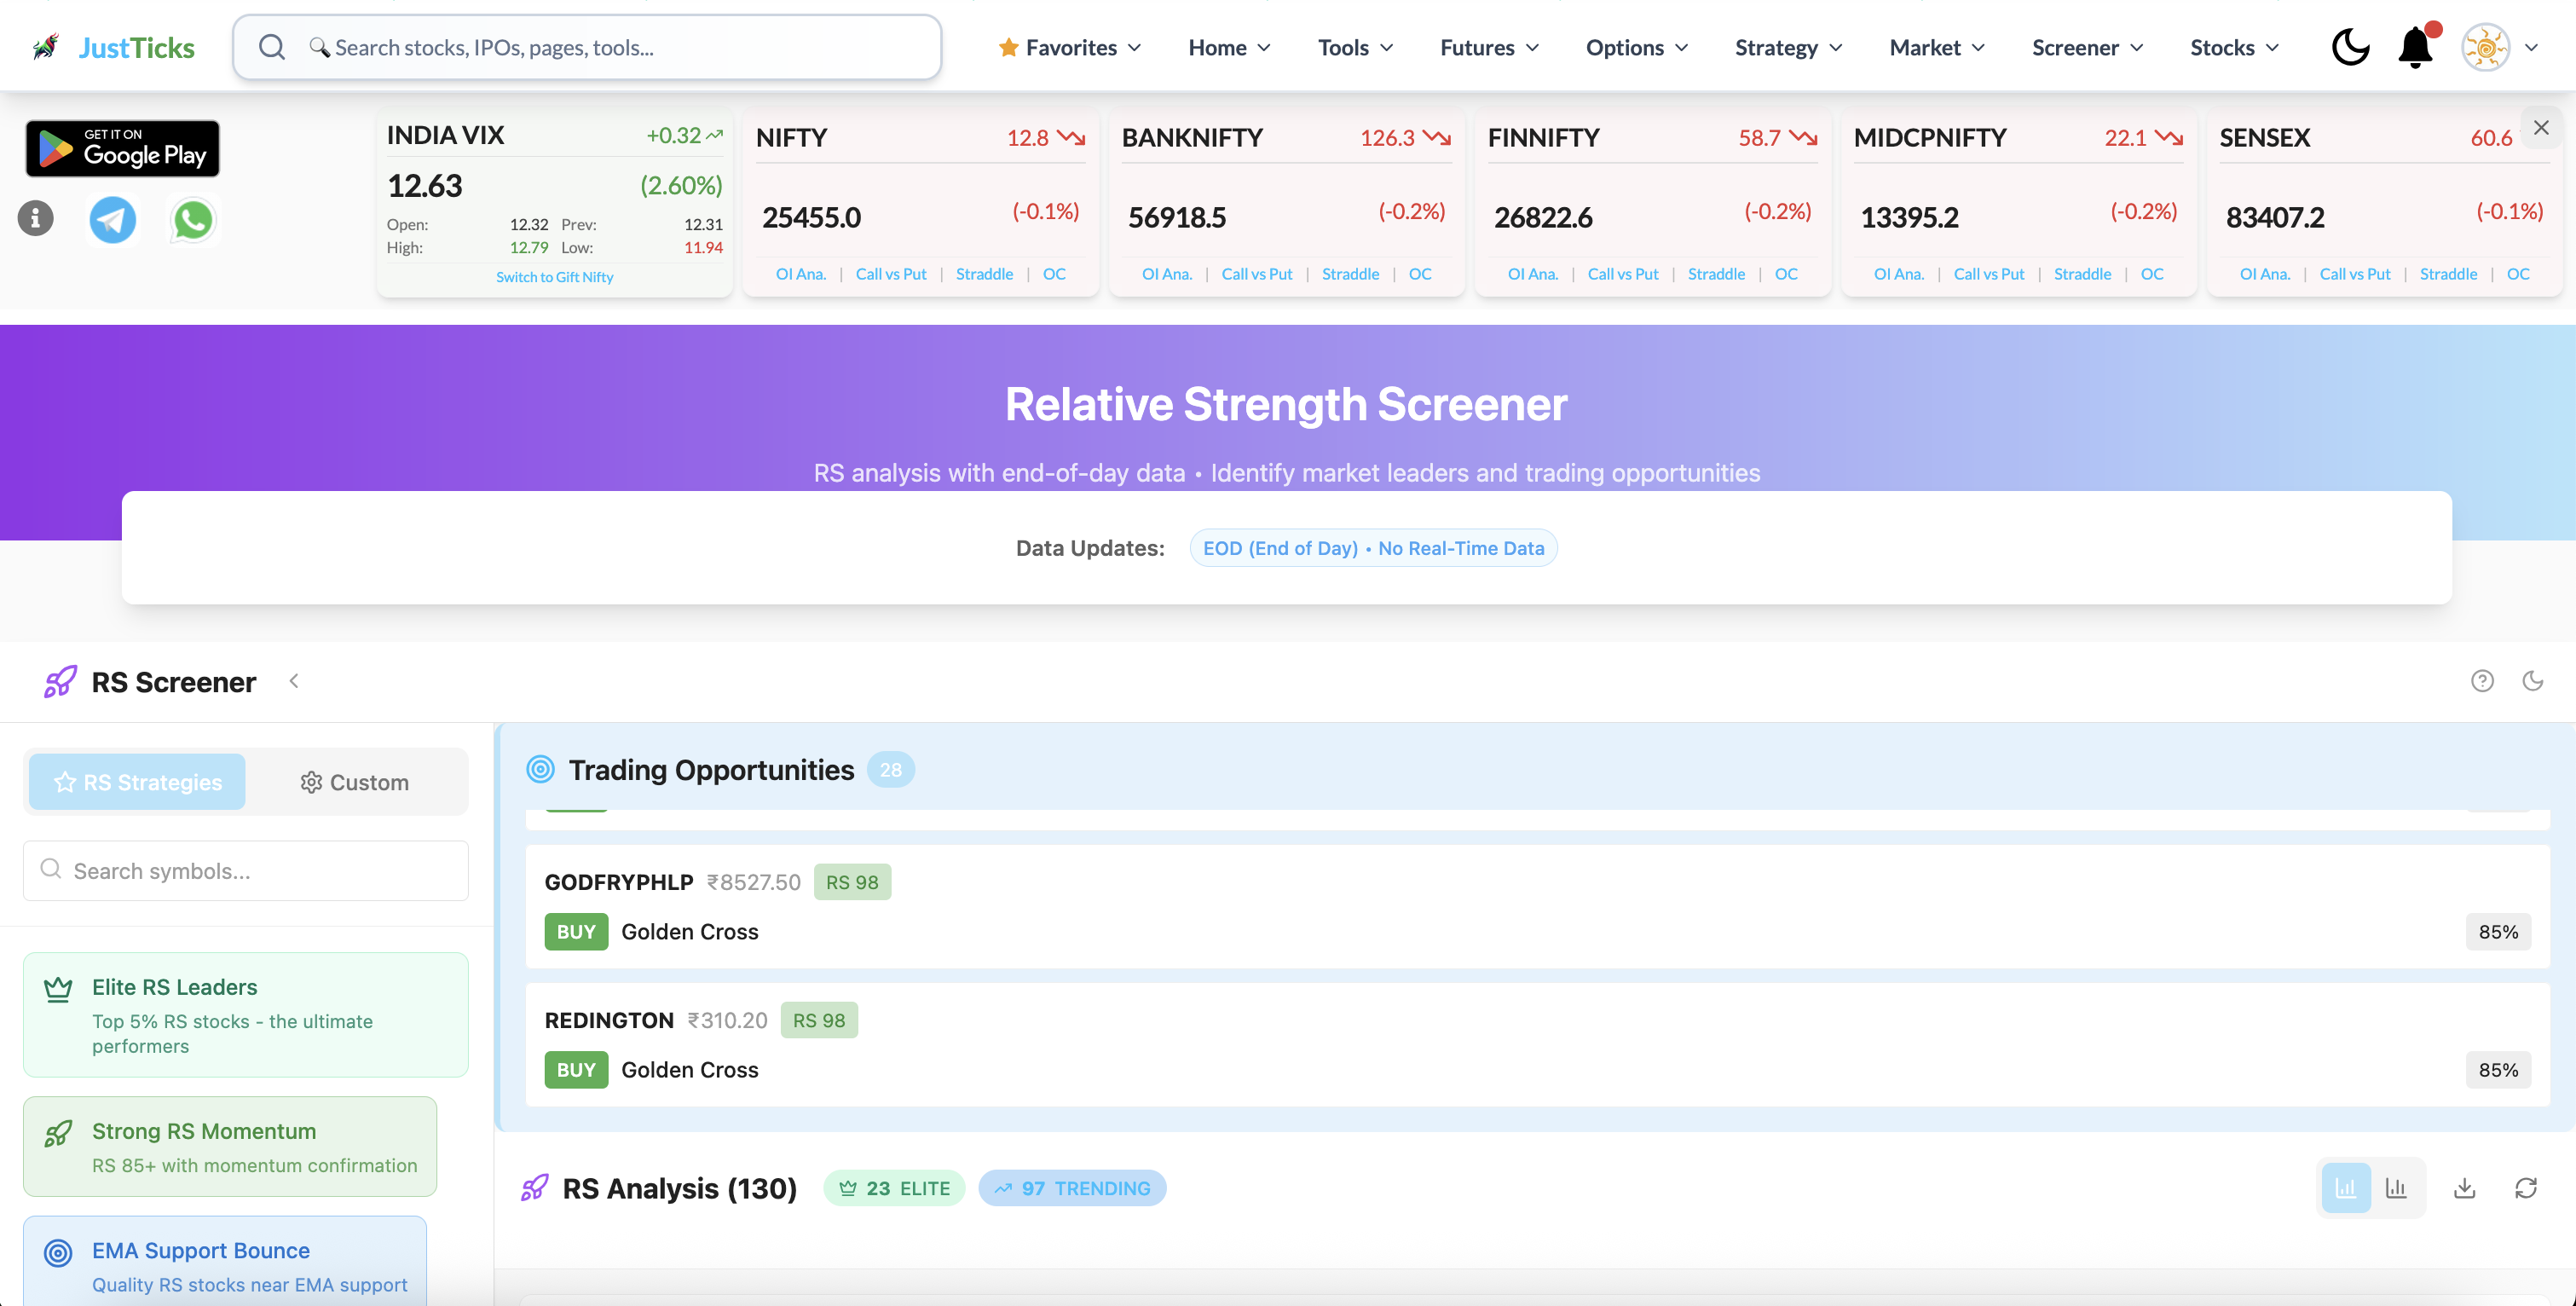
- Identify the data frequency. This interface identifies end-of-day data rather than a live intraday scan.
- Choose preset or custom filters. A strategy preset and a custom rank filter are different ways to limit the list.
- Select a leadership group. Elite and momentum groups apply different relative-strength conditions.
- Read rank with price context. A high RS reading is relative performance; it does not guarantee a positive future return.
- Open Relative Strength and check the end-of-day update.
- Choose an RS strategy group or a custom filter.
- Compare the rank with the stock chart and its benchmark over the same period.
- Use trend or new-high context to distinguish improving leadership from a short bounce.
- Review a small shortlist rather than treating an RS score as an entry instruction.
Why leaders matter
In rising markets, the stocks that were strongest before and during the pullbacks are often the first to make new highs. Relative strength lets you concentrate on those names instead of those that merely rose because the whole market did. In a falling market, the same ranking shows which stocks held up best.
Using an RS screener
| Filter | Purpose |
|---|---|
| RS rating high (for example 80+) | Restrict to market leaders |
| Trend regime (price above key averages) | Confirm the leader is in an uptrend |
| Momentum and ADX | Check the move is still active, not exhausted |
| Volume and liquidity | Make sure the stock can be traded |
| Risk state | Avoid overheated entries |
- Filter the universe to high RS ratings.
- Keep only those in a healthy trend.
- Sort by a setup score or by distance from a base to find entries, not just leaders.
- Build a watchlist and wait for a base breakout or a pullback to support.
A worked example
Stock A has an RS rating of 92, trades above its 50 and 200-day averages, and sits 4% below its 52-week high after a tight base. Stock B has a rating of 95 but is 35% above its 50-day average after a straight-line run.
B is the stronger leader on paper, but A is the better candidate for a new position: it is close to a base breakout and its stop would be tight. B belongs on a watchlist for a pullback.
Illustrative numbers for a hypothetical stock, not a recommendation or a past trade.
Limits
- It looks backward. A high rating describes past outperformance, not a guaranteed future one.
- Leaders can be extended. A top-rated stock far above its base is a poor entry.
- Ratings change with the universe. The rank depends on which stocks are included and on the period.
- Unadjusted data. Splits and bonuses can distort price-based comparisons; check the chart.