
Define the event before reading its history
A daily move is (current close − previous close) ÷ previous close × 100. Up mode keeps moves at or above the positive threshold; Down keeps moves at or below its negative; Both compares absolute magnitude. A 5% close-to-close move is not necessarily a 5% opening gap.
| Field | Meaning |
|---|---|
| Comparable events | Past sessions matching the direction and threshold definition |
| Next-day up/down | Observed direction in the eligible next-session sample |
| Continuation | Whether the following move followed the original event direction |
| Forward return | Change over the selected later-session horizon |
| Sample size | Number of events behind the displayed statistic |
Threshold presets, summary cards and focus screens
The control panel sets the event definition before any history is shown. The one-day move threshold has presets of 1%, 2%, 3%, 5%, 7.5%, 10%, 15% and 20%, and a note beneath states what is being scanned, such as moves of 5% or more in absolute terms. Direction switches between Both, Up and Down. You can also set the trading universe, a minimum price and a minimum volume to keep illiquid names out, scan a past session with backtest mode, open stocks in a new tab so the filters stay intact, and let the page poll for new data every minute.
- Summary cards. The number of threshold breaches with their average absolute move, how many were up moves and how many were down moves, and how many breached with relative volume of at least 1.5 times normal.
- Threshold Tape. Every stock that breached the selected one-day threshold in the latest session.
- Volume Confirmed. Breaches that traded with relative volume of 1.5 times or more, a sign that participation supported the move.
- Follow-Through History. Stocks whose past events of this kind continued the next day at least 55% of the time.
- Fade Candidates. Stocks where the history leans against the direction of the move on the next day.
The tape lists each symbol with its sector, the one-day move, the close and its change, the day's range as a position bar, relative volume, volume and a next-day up percentage with its event count, such as 6 of 9 events. The base rates are close to close and use two years of that stock's own history.
Read the event count beside every percentage. A 67% next-day figure built from 6 of 9 events is a small sample, and the focus screens that filter by a percentage do not remove that uncertainty. Treat them as places to look first, not as signals.
Use the event ledger
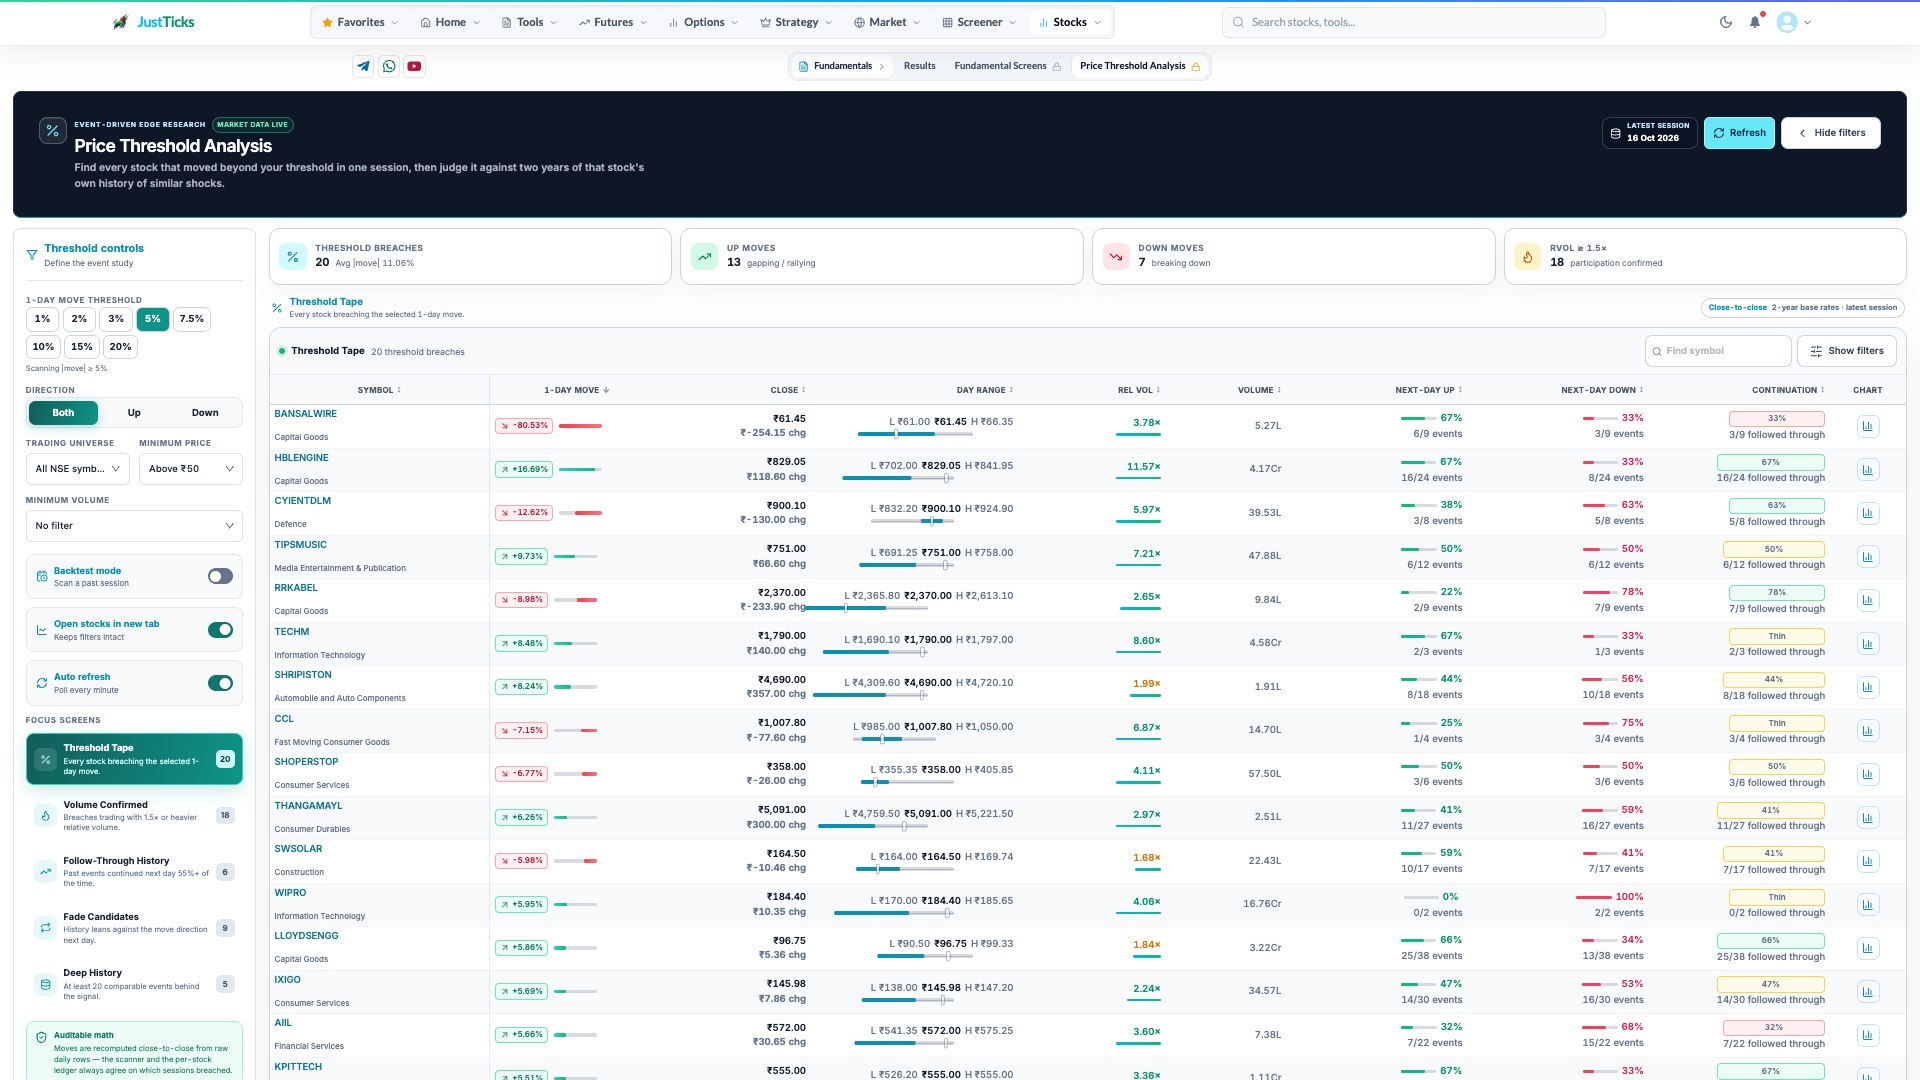
- One-day threshold. The event is a one-session move beyond the selected absolute percentage.
- Observed move. Read the actual move, close and day range for the pictured session.
- Historical base rate. Check both the percentage and the sample size; a handful of events is a weak baseline.
- Continuation. Continuation uses the tool’s event definition and should not be read as a guaranteed next-day outcome.
- Open Price Threshold Analysis, choose the threshold, direction and session.
- Set universe, minimum price and volume conditions before comparing rows.
- Read each stock's sample size next to its historical percentages.
- Select a symbol to inspect the event dates, candle details and 1D/5D/10D/20D forward returns.
- Compare median, dispersion and adverse outcomes instead of reading only the average or continuation percentage.
A historical percentage needs its denominator
If six of ten comparable past up-move events were followed by another rise, the observed rate is 60% in that ten-event sample. That is not a guaranteed 60% chance for today. Overlapping events, market regime and a small sample can materially change the interpretation.
Historical analogues can be unstable
- Changing the threshold or direction creates a different event sample.
- Repeated events during one episode can be correlated rather than independent.
- The average can be dominated by a few extreme observations.
- Forward outcomes near the latest date may be unavailable; read eligible counts.
- Expected-price references are projections from historical averages, not reliable price targets.