
Choose the correct analysis workflow
The directory lets you open an index or search for a stock symbol. The terminal is a single-instrument view, while Technical Screener searches across stocks for matching conditions. Keep those jobs separate: a screener result narrows a research list; the dashboard helps inspect that symbol in detail.
Sign in to use the terminal. These instructions are public. Available observations depend on the underlying data feed; check the source timestamp rather than assuming that opening or refreshing a page provides a new quote.
Screenshot: choose a dashboard
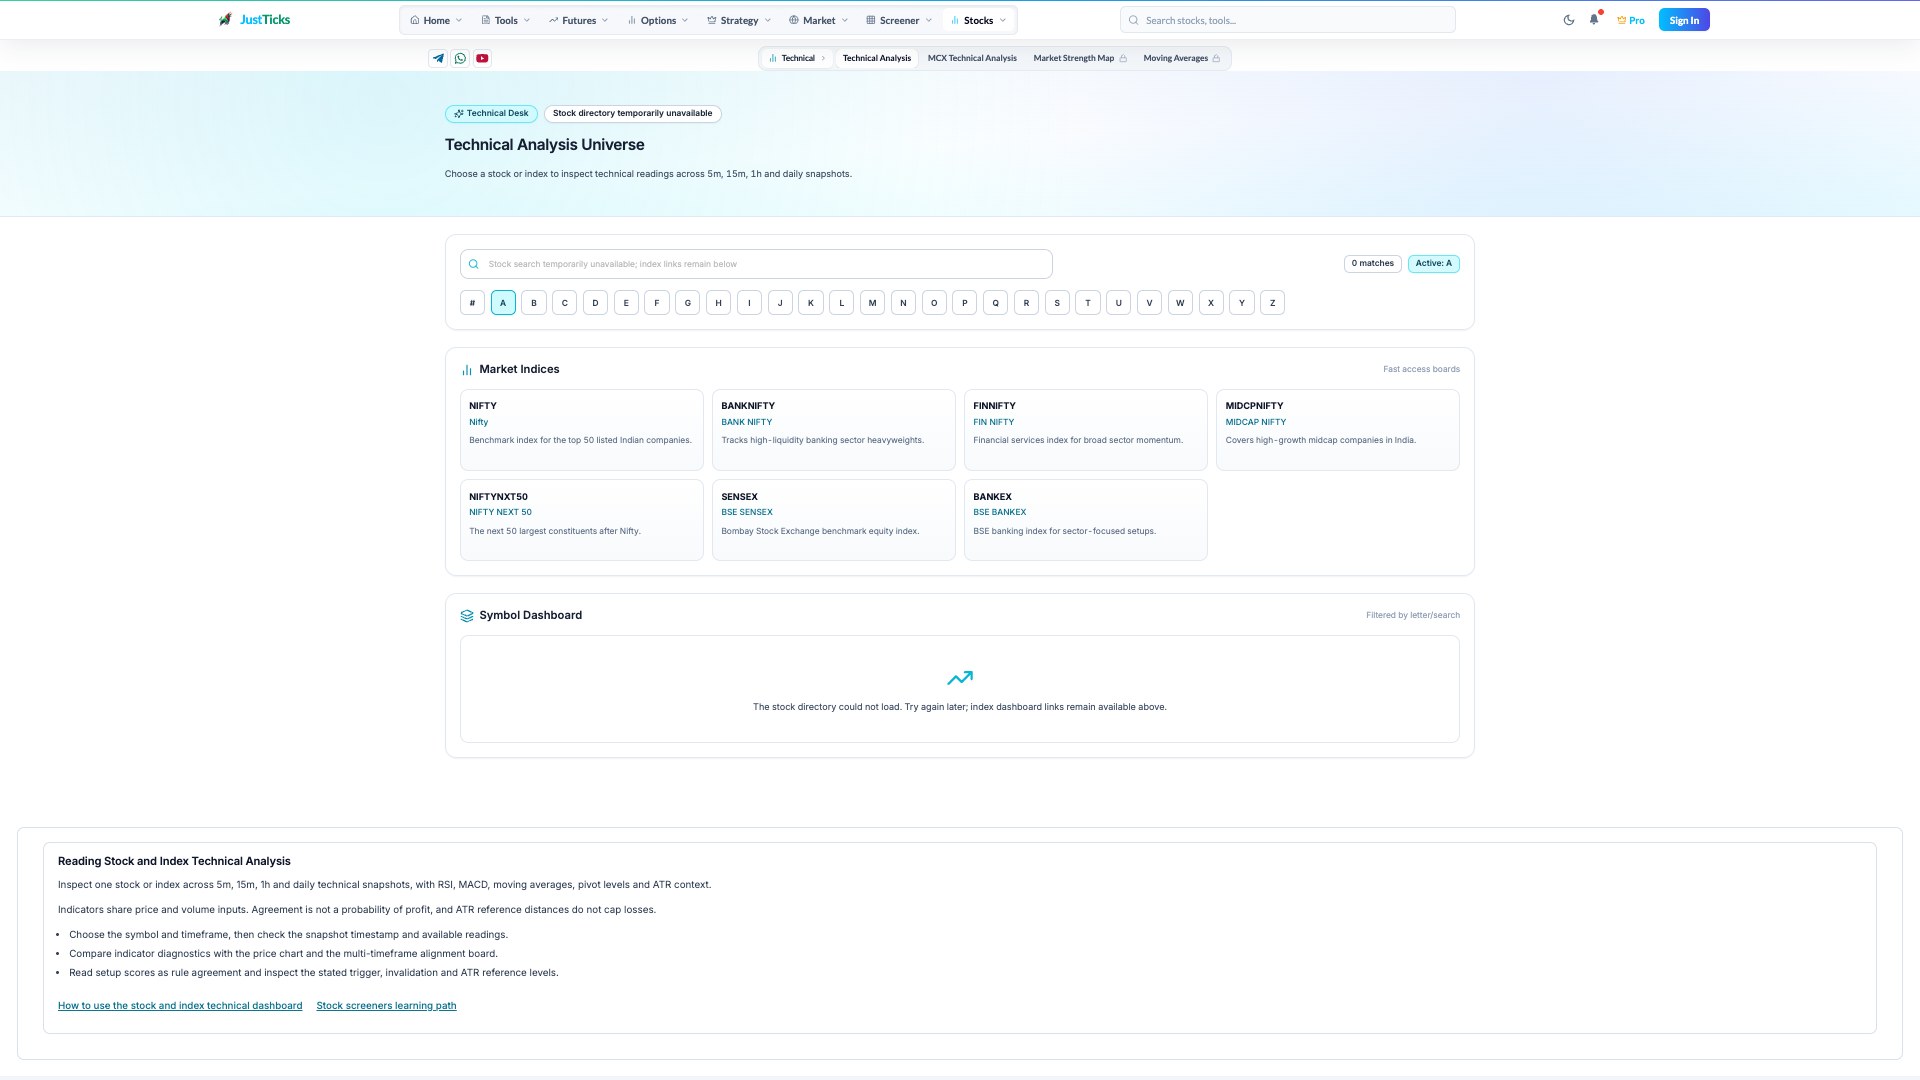
- Search the stock symbol. Use the symbol search to narrow the directory; selecting a symbol opens its technical terminal.
- Choose the index dashboard. The index cards open one underlying at a time. Check the symbol in the resulting terminal heading.
Set the symbol, interval and observation context
- Open the linked directory and choose the instrument. Use the index cards or stock-symbol search.
- Sign in to open the technical terminal. Confirm the instrument in the terminal heading.
- Choose 5m, 15m, 1h or 1d. The selected interval drives the chart and the main snapshot panels.
- Check the timestamp badge. Refresh requests available observations; it does not guarantee that the source has a newer candle.
- Inspect the price chart, indicator diagnostics and setup conditions, then compare the multi-timeframe alignment board.
- Review pivot methods and the ATR reference map. Treat missing readings as unavailable rather than as neutral confirmation.
What the terminal panels measure
| Panel or control | How to read it |
|---|---|
| Price Action | A chart for the selected symbol and interval. Inspect the candle history and quote time before interpreting a label. |
| Indicator Diagnostics | RSI, MACD, ADX, MFI, moving averages and other available readings with a rule-based interpretation. |
| Regime, momentum and participation | Composite model scores from selected indicator rules. These are neither exchange measurements nor calibrated success probabilities. |
| Setup Engine | Ranked rule matches with checks, a trigger and an invalidation condition. A higher rank describes the model’s fit. |
| Nearest Action Levels | Calculated pivot and moving-average references ordered around the snapshot close. They are not resting orders. |
| ATR Risk Map | Reference trigger, invalidation and level distances derived from price and historical range. They do not establish cash loss per contract. |
| Multi-Timeframe Alignment Board | Compare available 5m, 15m, 1h and daily snapshots. Read their timestamps; missing intervals reduce the evidence. |
| Advanced Lab | An optional expanded view of cross-timeframe indicators, trend and support/resistance. Open it after checking the basic measurements. |
Read trend, momentum and volatility separately
- Moving averages describe price relative to its smoothed history. Several moving averages share the same price inputs.
- RSI describes relative momentum over its calculation window. A high or low reading alone does not establish an impending reversal.
- MACD compares moving averages and its signal reference. ADX describes trend strength within its calculation, rather than independently naming the direction.
- ATR measures historical range in price units. It does not measure direction or guarantee the next candle’s range.
- MFI and participation fields depend on volume inputs. Check availability and instrument type, especially when reviewing an index rather than a traded contract.
Example: conflicting intervals
A bullish daily classification and a bearish 5m classification can coexist: they describe different windows of the same price history. Confirm that both observations are current, then compare the selected setup’s trigger and invalidation with the chart. Do not average two scores into a probability of a profitable trade.
Common mistakes and interpretation limits
Do not count RSI, MACD and several moving averages as independent votes: they are derived from overlapping price history. Do not interpret a model score of 80 as an 80% win rate. Calculated support or resistance can be crossed; an ATR-derived invalidation can be exceeded by a gap or a fast move. Check the timestamp for each interval, missing input fields and whether the latest candle is complete.
For an index, distinguish the underlying index level from the price, volume and execution mechanics of a futures, options or ETF contract. Use the correct instrument history and units when moving from analysis to a trade plan.
Move between the related tools
Reference reading
Fidelity: Average True Range explains ATR as a volatility measure and describes how it uses historical ranges. The panel definitions above describe the JustTicks implementation; exchange or third-party definitions do not validate the model’s setup scores.