
The settings define the sample
| Control | What it changes |
|---|---|
| Candle timeframe | The duration represented by each observation |
| BB period | The moving sample for the price envelope |
| ATR period | The sample used for average true range |
| Percentile lookback | The history used to rank width and ATR |
| Percentile threshold | How rare a quiet observation must be |
| Minimum tight candles | How long the compression condition must persist |
Use a consistent contraction definition
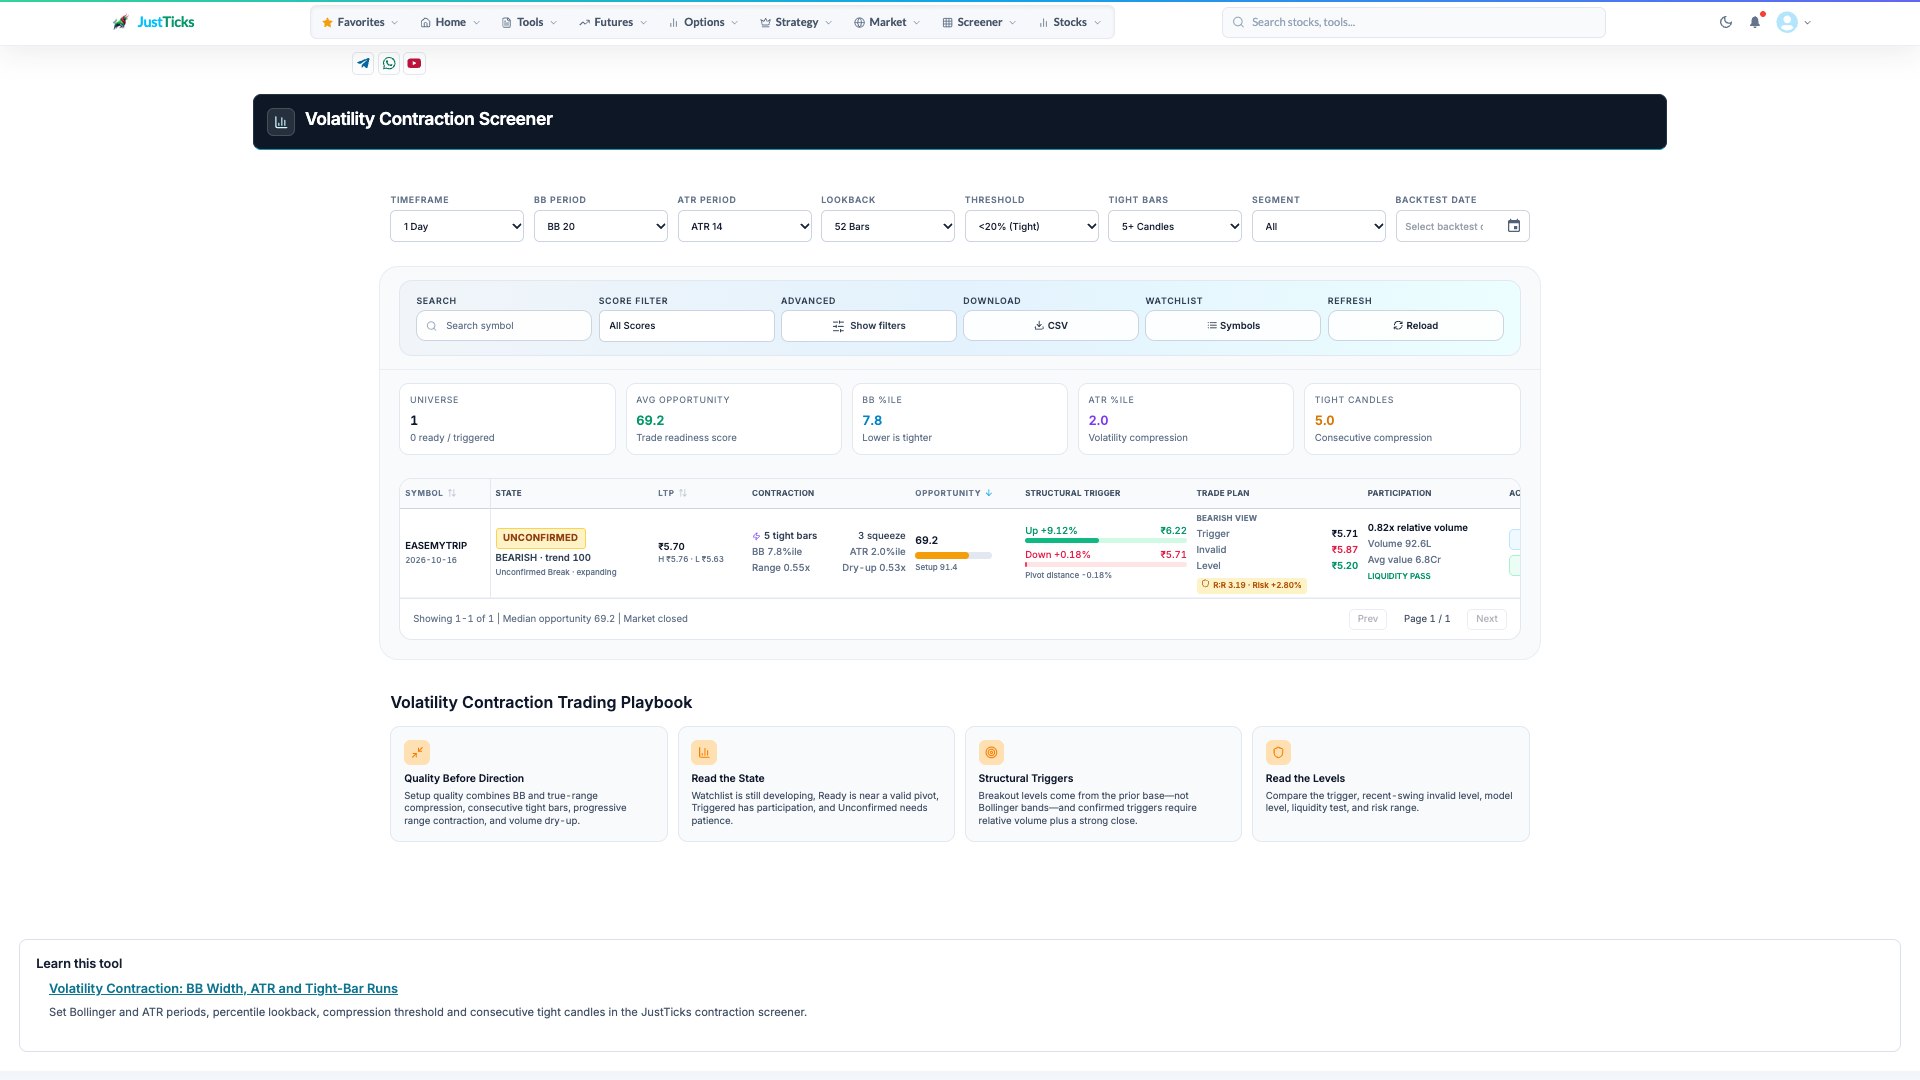
- Periods and history. Set BB, ATR and the percentile lookback before comparing compression.
- Tightness threshold. The threshold and consecutive tight bars control how selective the scan is.
- Contraction evidence. The row separates tight bars, percentile readings, range compression and volume dry-up.
- Structural levels. Trigger and invalidation are separate from a squeeze score.
- Open Volatility Contraction and choose the market segment and timeframe.
- Set the Bollinger and ATR periods, then choose the percentile-history lookback.
- Choose a compression threshold and minimum tight-bar count.
- Compare current state, base boundaries and participation in the resulting list.
- Review a historical session using the same settings so a changed definition does not masquerade as changed market behavior.
Five candles depends on the timeframe
Five qualifying 5-minute candles describe about 25 minutes of sampling. Five daily candles describe five trading sessions. The count is the same, but the market behavior and response horizon are different.
Compression and direction are separate
- Low width and ATR can persist without an immediate breakout.
- Changing the percentile history changes the rarity comparison.
- Small baselines and illiquid candles can create misleading compression.
- A confirmed expansion state describes a completed set of conditions, not future profitability.
Which volatility tool should you use?
Use this workspace when you want direct control over compression periods, percentile thresholds and tight-bar runs. Use the Volatility Screener to compare broader research states and the cross-sectional regime map.