
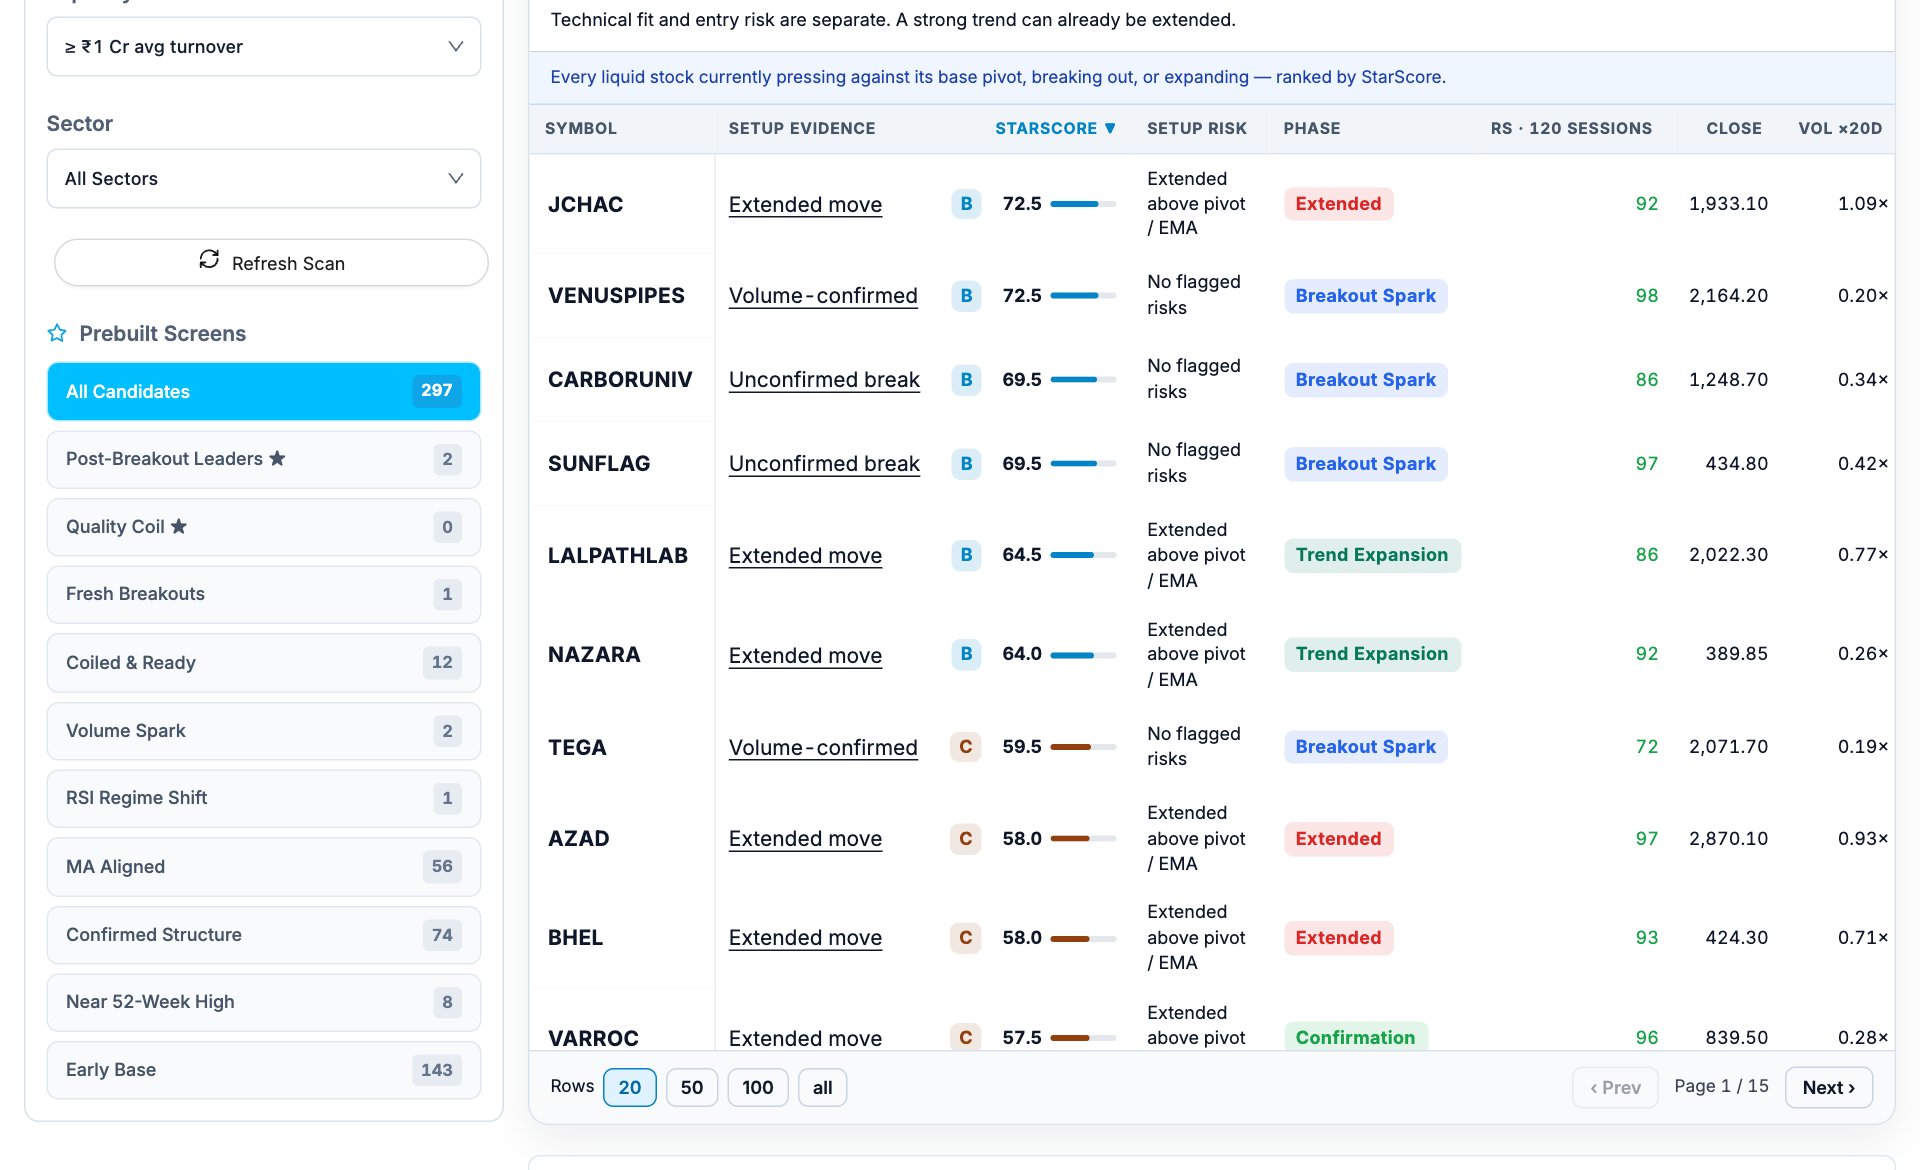
Read score, phase and risk separately
| Field | Question |
|---|---|
| StarScore | How closely does the stock match the selected template? |
| Phase | Is the model in an early base, a coil, breakout or later expansion? |
| Setup risk | Is price extended relative to the pivot or moving averages? |
| RS · 120 sessions | How does recorded historical performance rank in its comparison universe? |
| Volume multiple | How does the selected volume compare with its baseline? |
The pivot here means the top of the detected base. It is different from the calculated PP level in the Pivot Screener.
Build a phase-specific watchlist
- Choose the phase. Quality Coil and Fresh Breakouts represent different stages.
- Read technical fit. StarScore measures current template fit, not a future return probability.
- Check extension separately. Setup risk can flag an extended move even when fit is strong.
- Read the current phase. An Extended label identifies distance already traveled rather than a new breakout.
- Open JustTicks Stars, select timeframe, base window and universe.
- Set the average-turnover floor to keep a consistent liquidity scope.
- Choose Quality Coil for a pre-breakout study or Fresh Breakouts for recently qualified breaks.
- Read setup evidence, phase and setup risk together rather than sorting only by StarScore.
- Open the chart and inspect the base, pivot, breakout-day volume and distance already traveled.
A better score can coexist with more extension
A stock with StarScore 80 can be marked Extended, while a stock with score 70 remains near its base pivot. The first has a stronger template fit but may have moved farther from the reference. The score alone does not resolve that tradeoff or determine an entry.
What the template does not prove
- A 0–100 score is a heuristic rank, not a future-return probability.
- A strong historical relative-strength rank does not guarantee continued leadership.
- Price-volume bases do not identify the buyer or establish institutional intent.
- A fresh breakout can fail and return to its base.
- Review timeframe and base-window changes before comparing different scans.