
A zone is different from one exact price
Nearby pivot highs or lows can be grouped into a channel rather than treated as unrelated lines. Strength and proximity describe different things: strength summarizes the historical evidence, while proximity describes the latest price distance.
| State | Interpretation |
|---|---|
| Near Resistance | Price is close to the selected upper reference |
| Near Support | Price is close to the selected lower reference |
| Resistance Broken | The model break condition above an upper reference is met |
| Support Broken | The model break condition below a lower reference is met |
| Range Balanced | Neither proximity nor break condition dominates |
Review zones and the next level
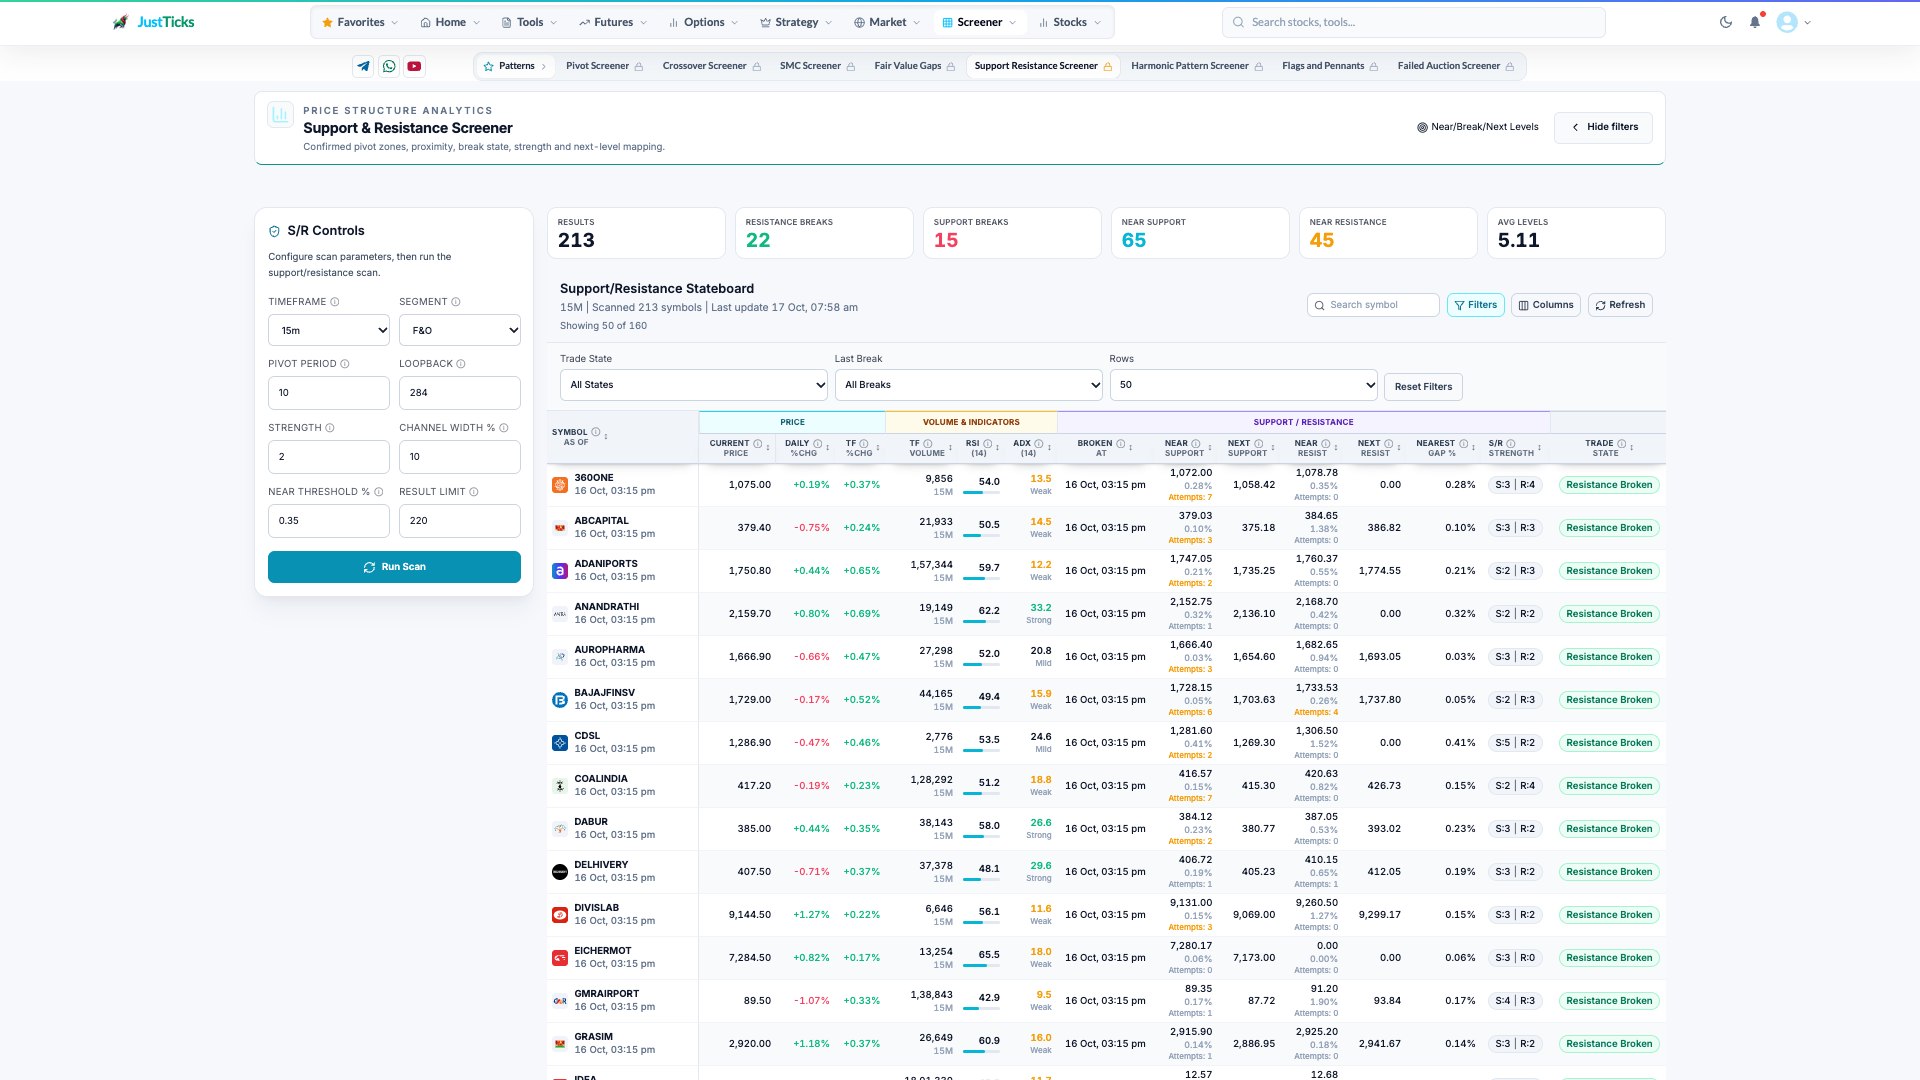
- Timeframe. The interval defines the candles used to locate the levels.
- Pivot period and lookback. These parameters change which historical turning points enter the scan.
- Nearby levels. Distinguish the closest level from the next level beyond it.
- Trade state. Near support, near resistance and a broken level have different meanings.
- Open Support & Resistance Screener and select timeframe, universe and lookback settings.
- Choose a state such as Near Resistance or Resistance Broken.
- Read the current price, zone boundaries and distance before comparing strength.
- Select a symbol to inspect the detailed price chart and pivot-channel construction.
- Check the next mapped zone only after confirming which reference was broken and when.
Near a zone is not a fresh break
If resistance is a zone from 100 to 101 and price is 100.8, the symbol is interacting with that zone. A later close above its break reference is a different condition. If the close returns below, the earlier proximity label did not guarantee acceptance above resistance.
Context can invalidate a historical zone
- Pivot detection depends on timeframe and confirmation rules.
- More touches can reflect a watched zone without guaranteeing it remains defended.
- An incomplete candle can briefly cross and return before the close.
- Gaps can skip a zone and alter the meaning of a measured distance.