
Raw IV and historical context
Raw IV is a model-implied annualized measure from option prices. It is different from IV rank, which places it within a historical range, and IV percentile, which compares it with eligible past observations. A stock with higher raw IV need not be more unusual relative to its own history.
Choose comparable expiry scope and read liquidity, available IV statistics and any realized-volatility comparison together. Statistics can have their own reference window and data-availability requirements. Missing history is not zero volatility.
Screenshot: controls and readings
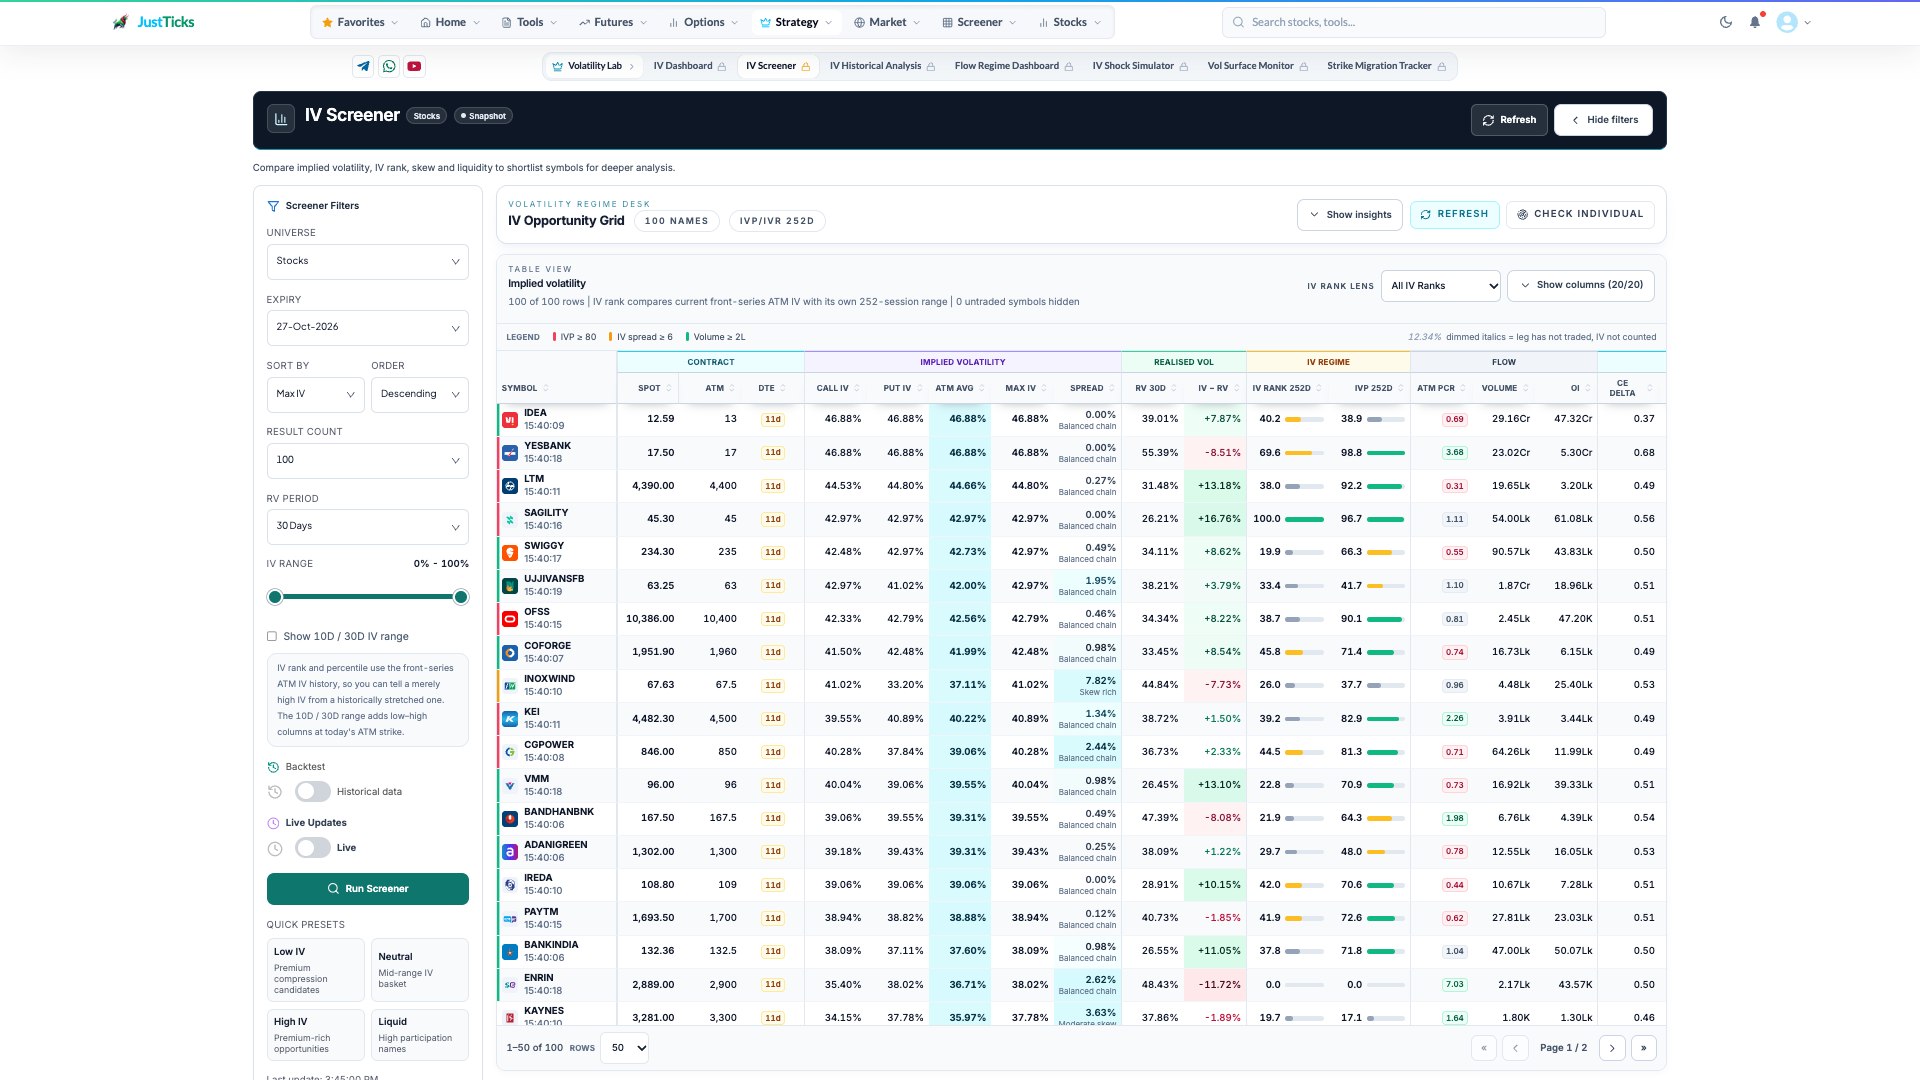
- Expiry and universe. Compare contracts with similar expiry distance and the selected stock/index scope.
- Implied volatility. Call IV, put IV and ATM averages are different summaries.
- Historical context. IV rank and percentile place current IV in its own history rather than ranking expected returns.
- Liquidity and OI. Check traded activity and open interest before interpreting an extreme reading.
Use the screen and inspect one name
- Select the universe and expiry setup. Choose snapshot or historical date where available.
- Set the IV range and sort measure, direction and result limit. Apply or refresh the screen.
- Enable historical IV statistics when needed and read the stated reference window. Keep the same definition when comparing names.
- Check call-put skew, IV rank, IV percentile, IV-versus-realized-volatility context and liquidity instead of relying on one high number.
- Inspect a name in the detail panel, then open IV Historical Analysis to verify its timeline. Use the strike IV chart for the selected expiry’s contracts.
Worked example: high raw IV can be ordinary
A hypothetical stock at IV 40% may be close to its normal range, while another at 25% may be at a historical extreme. Sorting by raw IV places the first higher; sorting by a comparable percentile can reverse their order. Neither ordering independently determines the right option position.
A shortlist is the start of investigation
Events, short expiries, wide spreads, stale LTPs and sparse history can create apparent extremes. IV above realized volatility describes different horizons and assumptions; it is not guaranteed income. Confirm the contract, data time and executable prices before evaluating a modeled strategy.