
A contract-level historical screen
The expiry, lookback, observed-day requirement and skip settings define the reference sample. Read Signal Date and Peak Date separately: the most recent observed day is not necessarily the day of the largest volume. This tool uses daily historical observations, so its readings are not tick-by-tick orders.
The OTM % column describes the percentage of observed days on which the strike remained out of the money. It is not the current percentage distance from spot. Current moneyness must be checked against the underlying price and contract type.
Screenshot: controls and readings
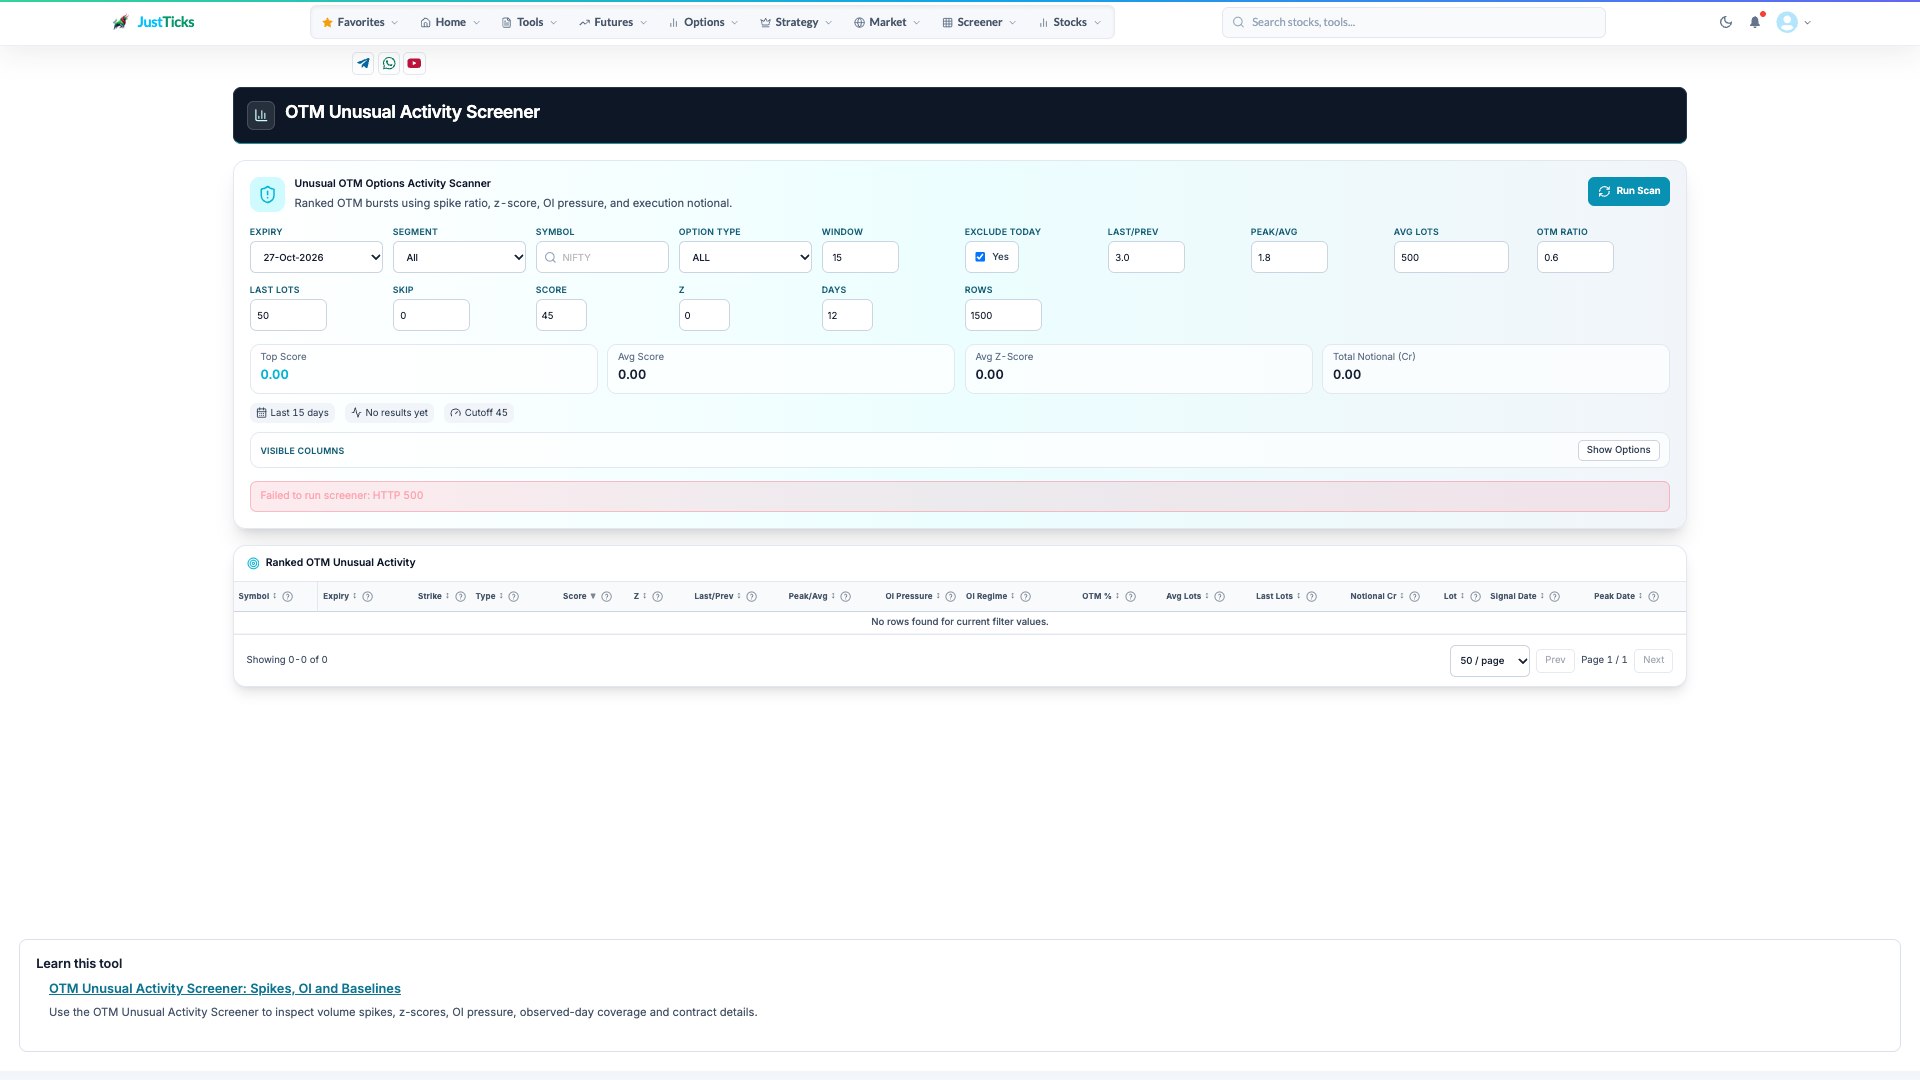
- Contract scope. Choose expiry, segment, symbol and option side before interpreting an unusual-volume result.
- Baseline thresholds. Last/previous and peak/average compare different volume windows.
- Coverage. Minimum observed days and row limits affect the set that can qualify.
- Request status. This local capture shows a failed data request. An empty table here is not evidence that no unusual activity occurred.
Read the diagnostics separately
| Column | What it compares | Check before interpreting |
|---|---|---|
| Last/Prev | Latest lots divided by the previous average lots | The absolute lot count and baseline size |
| Peak/Avg | Highest lots in the window divided by average lots | The peak date and chosen lookback |
| Z | Latest volume relative to recent distribution | Enough observations and a stable baseline |
| OI Pressure | Latest OI change relative to average absolute OI change | The actual OI change and normalization |
| Score | A composite of unusualness diagnostics | The component measures, not just the ranking |
| Notional Cr | Latest daily traded notional in crore | The units, quantity normalization and contract |
Inspect a burst step by step
- Choose expiry and the available universe or symbol filters. Set the lookback and any skipped recent days deliberately.
- Choose minimum observations and unusualness filters, then run the screen. Check the covered dates and result count.
- Compare latest lots with average lots before interpreting Last/Prev or the z-score. Small baselines can create large ratios.
- Read OI pressure, OTM consistency, signal date and peak date. These qualify the activity but do not identify the initiator.
- Open a row’s detail history to inspect whether the burst is isolated or persistent. Confirm the contract, underlying price and liquidity in the option chain.
Worked example: the denominator matters
A contract going from an average of one lot to ten lots has a Last/Prev ratio of 10. Another going from 1,000 lots to 3,000 has a ratio of 3. The first has the bigger relative spike; the second has much larger absolute trading activity. Both the ratio and the base count matter.
These are illustrative figures. Notional and open-interest changes add context, but volume multiplied by a snapshot price does not reconstruct every execution or establish net capital invested.
Activity is not evidence of informed direction
A large trade can be a hedge, closing transaction or one leg of a spread. Stale prints, thin contracts, a short history and changing moneyness can distort rankings. Statistical unusualness is descriptive rather than a probability of profit. Verify current quotes, event exposure and contract details before building a scenario.