
What the dashboard aggregates
The universe, expiry, coverage and snapshot date define the population behind the charts. Counts and percentages refer to available names under that selection. Change the population and the aggregate can change even if the retained names have unchanged IV.
The IV Distribution groups available instruments into displayed volatility bands. Call-Put Volatility Pulse compares average call IV, average put IV and the displayed spread. Averages can hide large differences between individual names.
Screenshot: distribution and the covered universe
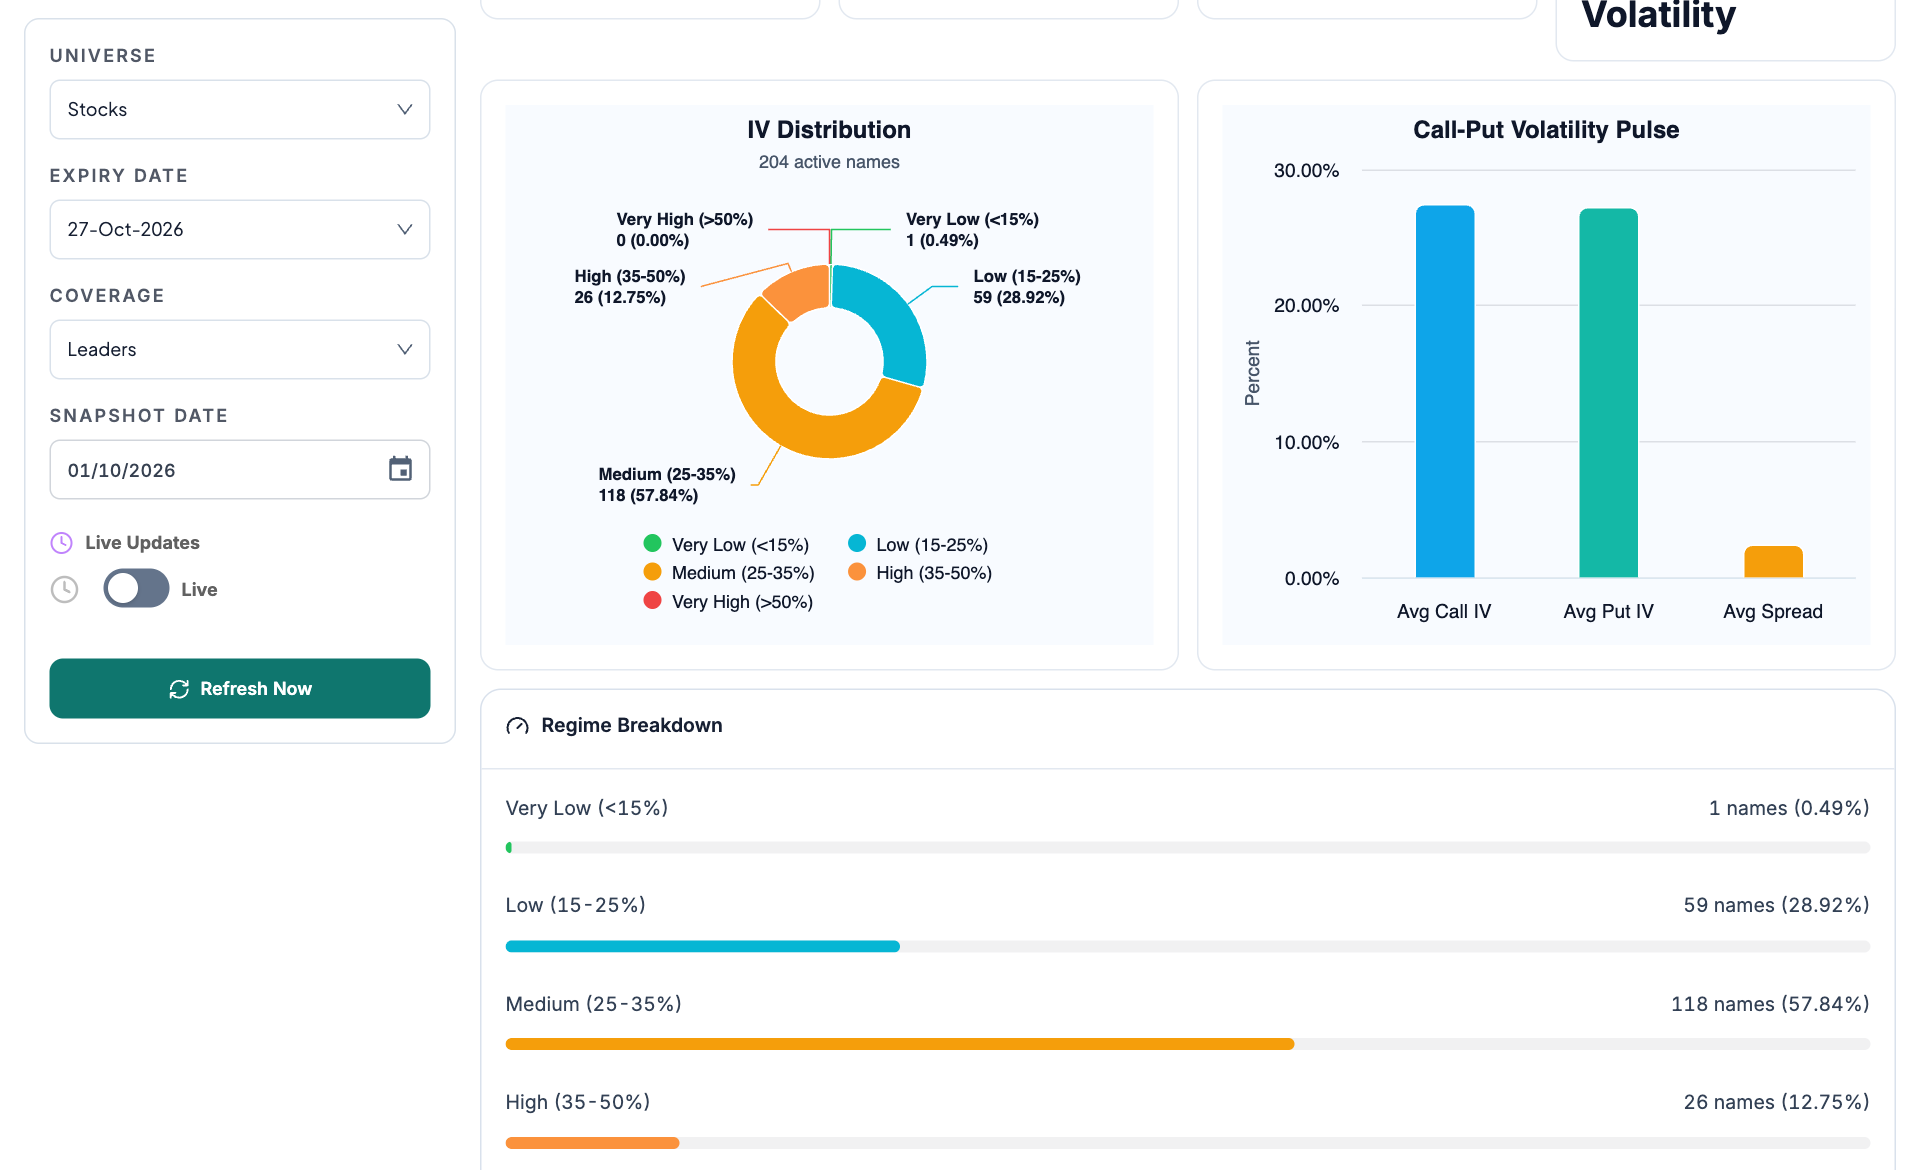
- Universe. Choose stocks or the supported alternative universe before comparing aggregates.
- Coverage. Leaders and broader coverage can represent different populations.
- Distribution. Read both the count of active names and the percentage within each band.
- Call-put averages. These are aggregate volatility measurements, not a single option’s IV or India VIX.
Read the dashboard in context
- Select universe, expiry coverage and observation date. Note the active-name count.
- Read the distribution before the averages. A narrow majority and a few extreme names can produce a misleading single average.
- Compare average call IV and put IV using the displayed definition of spread.
- Inspect the regime breakdown and available instrument detail to identify which names explain the aggregate.
- Open the IV screener to filter candidates and IV Historical Analysis to verify each name against its own past.
Worked example: a changing population
Suppose a covered basket has 100 names and 20 are above an IV threshold. The displayed proportion is 20%. If the next selection contains only 50 eligible names and the same 20 are included, the proportion becomes 40% without any change in their IV. Compare counts and coverage before describing a market-wide volatility increase.
Aggregate readings hide contract detail
Different expiry dates, moneyness conventions, quote freshness and available names affect comparisons. High average IV does not imply a profitable short-volatility position. Read the individual chain, events and pricing assumptions behind a shortlist.