
Selected contract versus historical regime
The expiry selector identifies the current contract view. The front-series historical regime uses its own rolling history, as labeled by the chart. Changing the currently selected expiry does not necessarily reset that reference series. Read the chart’s coverage and lookback before comparing instruments.
IV is a model-implied annualized volatility, not a directional return. IV rank places an observation within its historical range; IV percentile describes its rank among historical observations. One outlier can change IV rank substantially without making most historical observations unusually high.
Screenshot: a front-series historical view
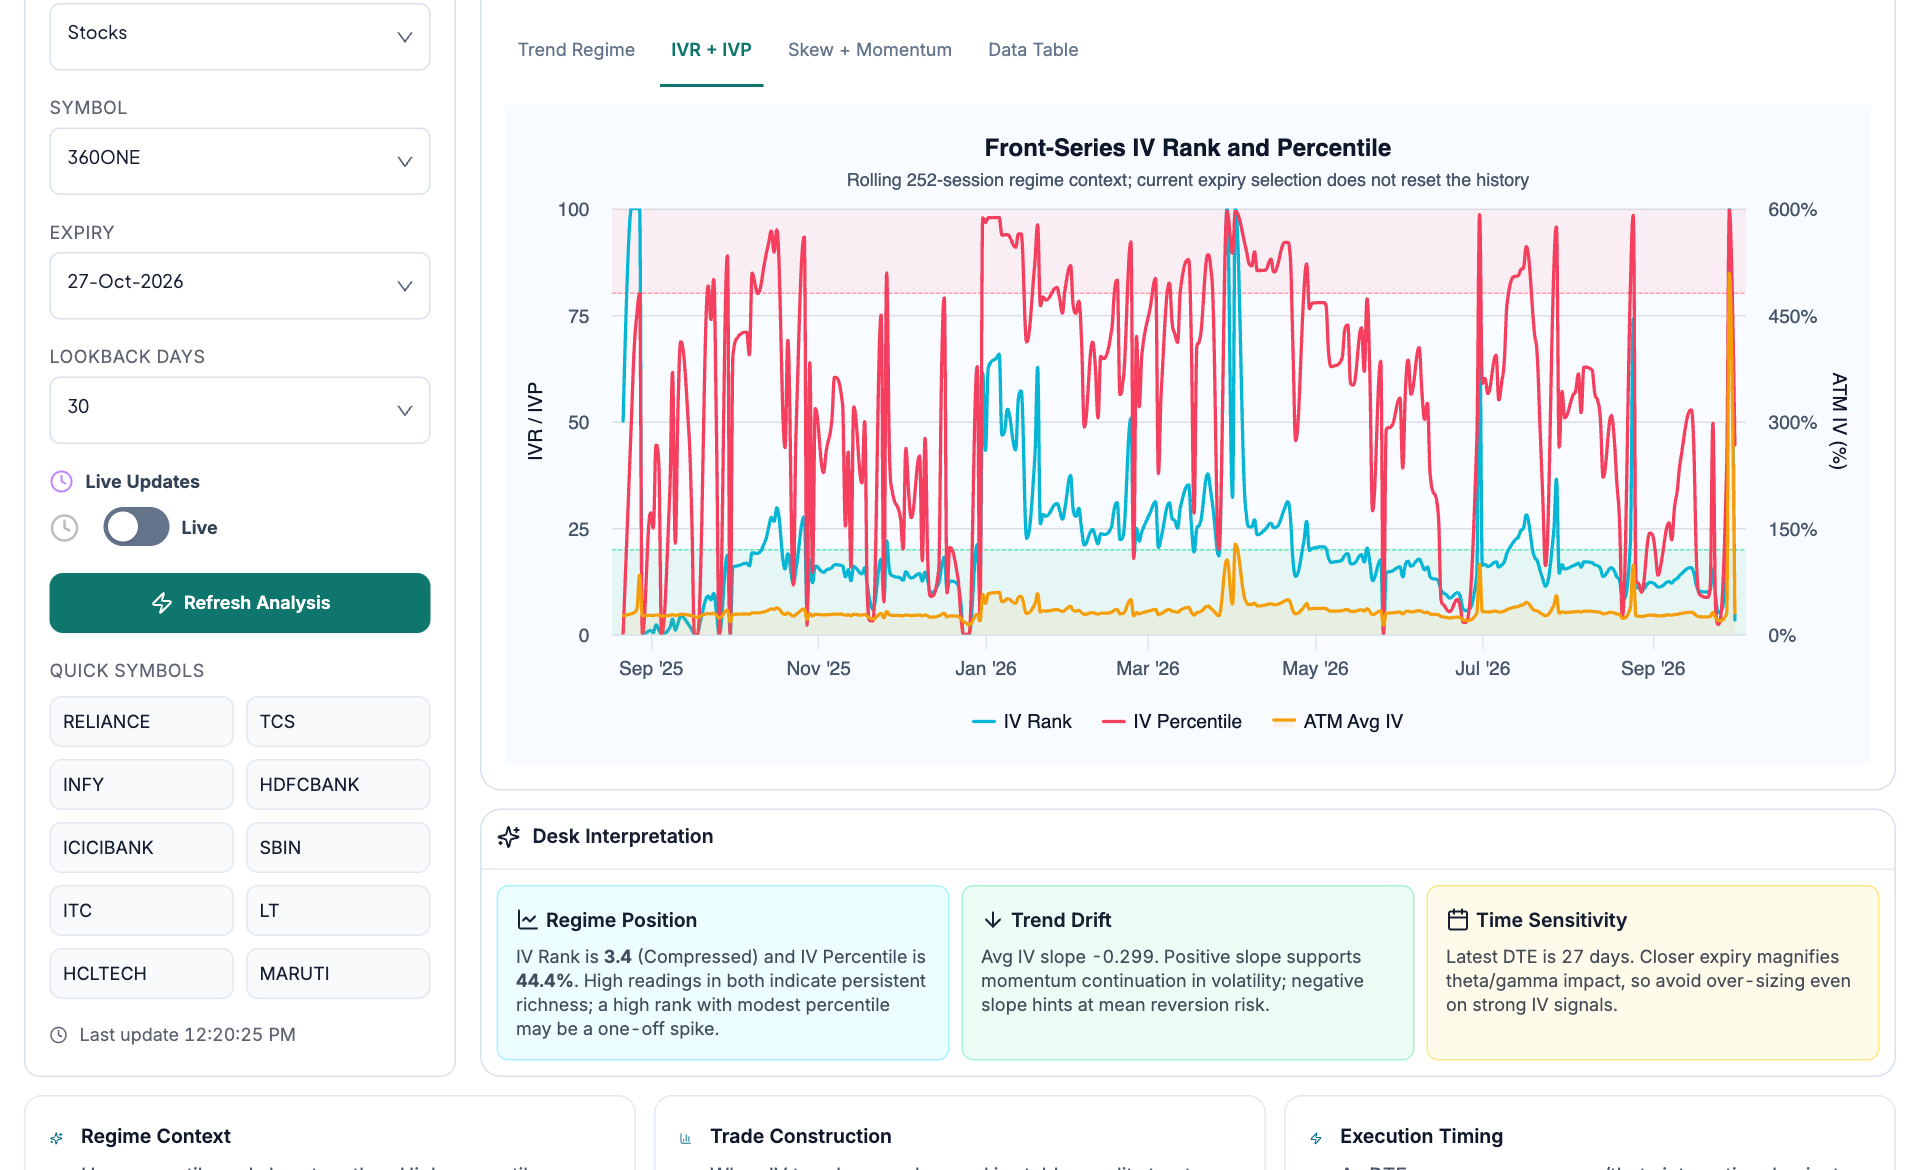
- Instrument and expiry. Choose the underlying and confirm which current expiry is selected.
- Requested lookback. This control chooses requested history. It does not change the definition printed on every diagnostic.
- Regime reference. The chart explicitly identifies a rolling 252-session front-series comparison.
- Different axes. IV rank and percentile share the left 0–100 axis. ATM IV is an annualized percentage on the right.
Inspect a candidate’s history
- Choose universe and symbol. Use a name from the IV screener if you are investigating an unusual current reading.
- Confirm expiry setup, requested lookback and whether the page shows a snapshot or developing live session. Refresh the analysis.
- Read the IV trend before the IVR + IVP view. Compare both rank measures rather than treating one elevated reading as a complete regime.
- Use Skew + Momentum to investigate whether call-put differences persist. Check the data table for observation dates and missing values.
- Open the corresponding IV chart to inspect a specific strike and expiry. Record which series supports each conclusion.
Worked example: rank and percentile disagree
Suppose current IV is 20%, its reference low is 10% and its high is 50%. The range-based IV rank is (20 − 10) ÷ (50 − 10) × 100 = 25. If 80% of the eligible past observations were below 20%, the IV percentile can still be 80. The old 50% spike stretches the range; these measures answer different questions.
The figures are illustrative. Actual results depend on the eligible history, front-series construction and missing-data rules printed by the application.
Coverage and comparability
The selected dates, front-series rolls, corporate events and stale prices can affect history. Thin quotes can create unreliable implied volatilities. Compare the same metric definition and sample scope; neither a high percentile nor a smooth trend establishes that an option is mispriced.