
Understand geometry before the ranking
X, A, B, C and D are selected swing points. Their distance ratios determine whether the shape fits a named family such as Gartley, Bat, Butterfly or Crab. The same price chart can produce different structures when the timeframe or swing definition changes.
| Reading | Meaning |
|---|---|
| Pattern type | The ratio template fitted to the selected swings |
| Ratio error | How far the observed geometry is from that template |
| Lifecycle | Whether the model is emerging, completed, triggered, tracking levels or failed |
| Trigger / invalid level | Model references for a transition and its invalidation |
| Conviction | A composite ordering of geometry and contextual inputs |
How to review a harmonic candidate
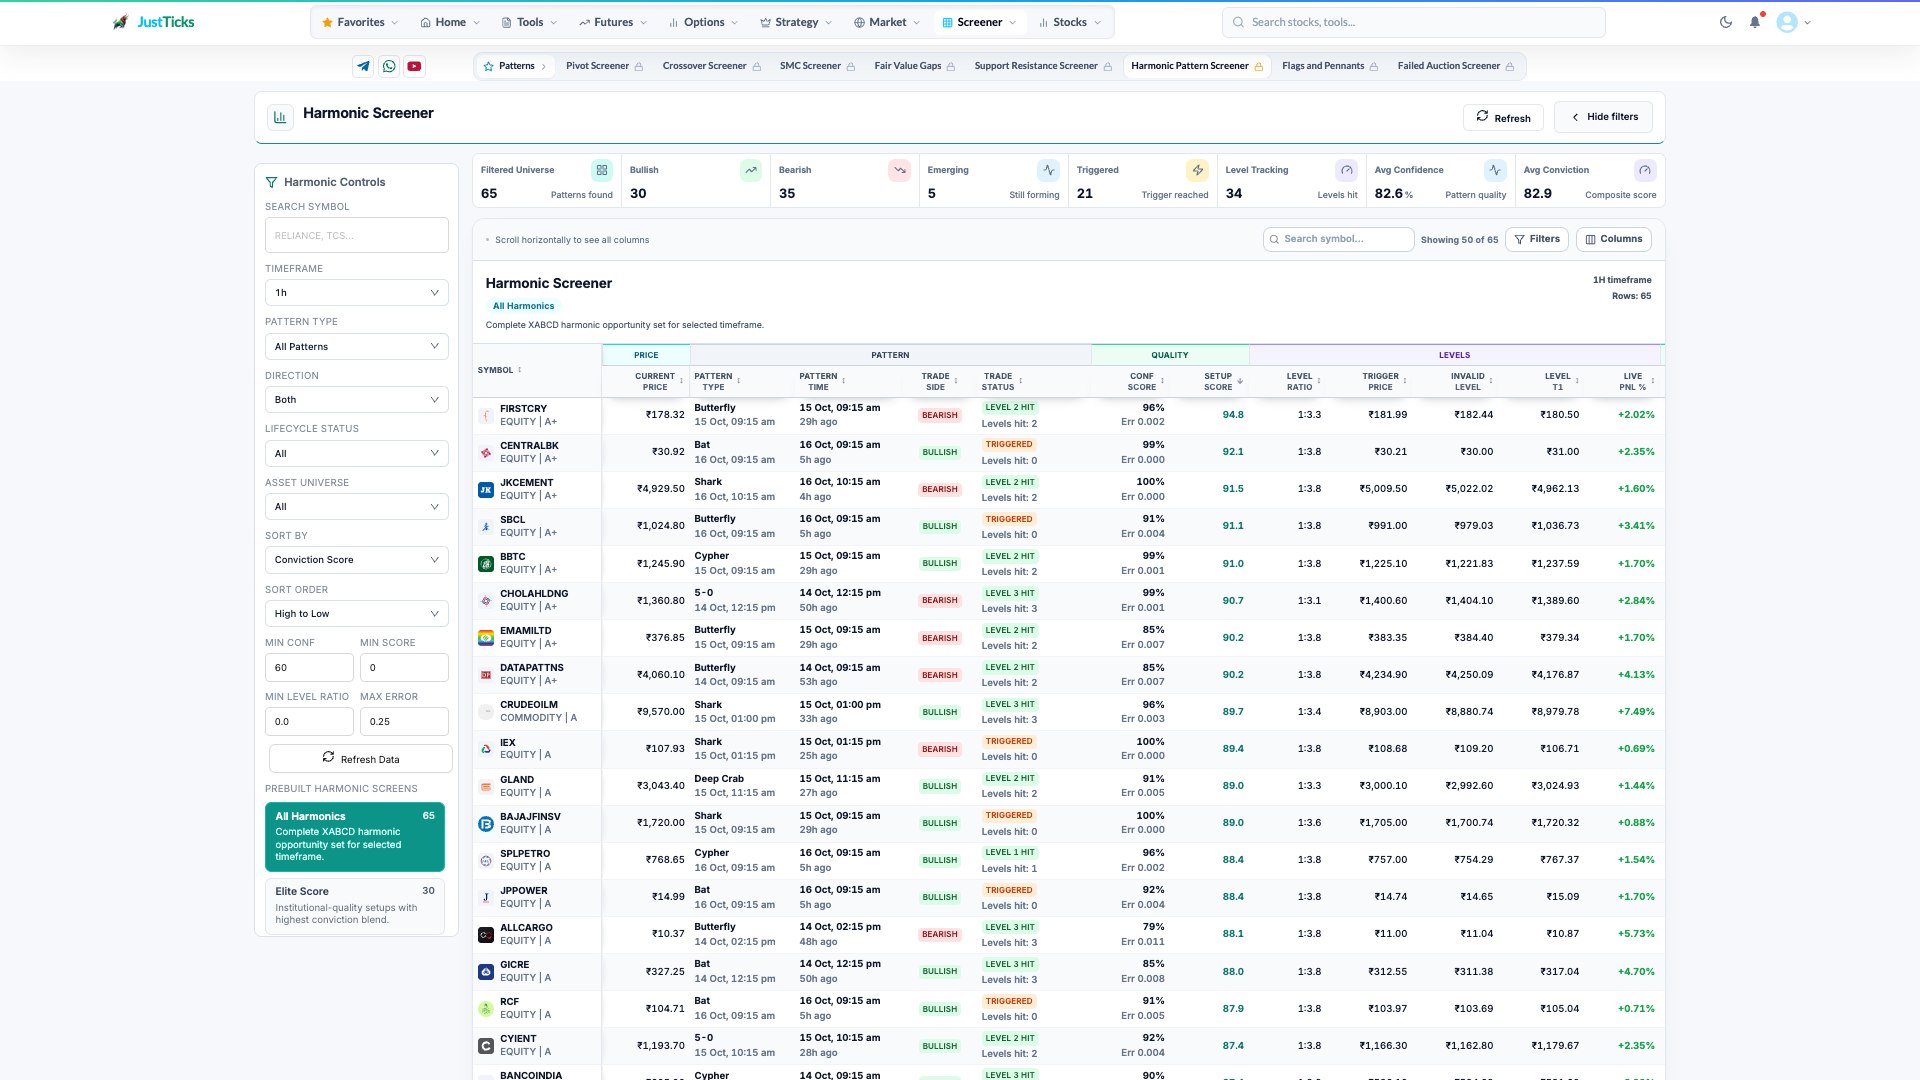
- Candle interval. Pattern anchors and confirmation belong to this timeframe.
- Lifecycle. A forming pattern and a triggered pattern are different states.
- Pattern and trade side. Read the detected structure and direction together.
- Price levels. Trigger, invalidation and model levels describe the setup; a historical label is not a forecast.
- Open the Harmonic Screener and choose timeframe and asset universe.
- Start with one pattern family and direction; avoid comparing unlike shapes only by score.
- Use Completed to inspect a finished template or Fresh Trigger to inspect a later qualifying transition.
- Read the XABCD chart, ratio error, trigger and invalid level together.
- Compare the observation time with later lifecycle updates. Level Tracking is a review of model progress, not an instruction to chase a move.
Geometry and confirmation are separate
Imagine a bullish template completes near 100, with a model trigger at 102 and invalidation at 97. A completed row at 100 has not yet met the 102 trigger. A later triggered row describes a new condition. The distance from 102 to 97 is five points; a target-to-risk ratio based on those levels still ignores fill quality, gap risk and costs.
Avoid reading confidence as a probability
- A low ratio error means a close geometric fit, not a high verified chance of profit.
- Swing selection and confirmation can require later bars.
- One chart can contain overlapping templates or opposite directions on different timeframes.
- Check absolute liquidity and extension as well as the score.
- Replay and lifecycle tracking describe observed candles; they do not simulate every executable fill.