
What one interval cell represents
An interval combines price movement, OI change and incremental volume for its selected time bucket. It labels that pair of price/OI signs as long buildup, short buildup, short covering or long unwinding. The label describes that bucket, not necessarily the whole day.
| Compare | Purpose |
|---|---|
| Adjacent intervals | Detect a transition or persistence |
| 30-minute versus 60-minute | Check whether a fast change survives aggregation |
| Price change versus OI change | Separate observed direction from outstanding-position change |
| Volume versus OI | Separate turnover of contracts from net creation or closure |
Read the interval matrix
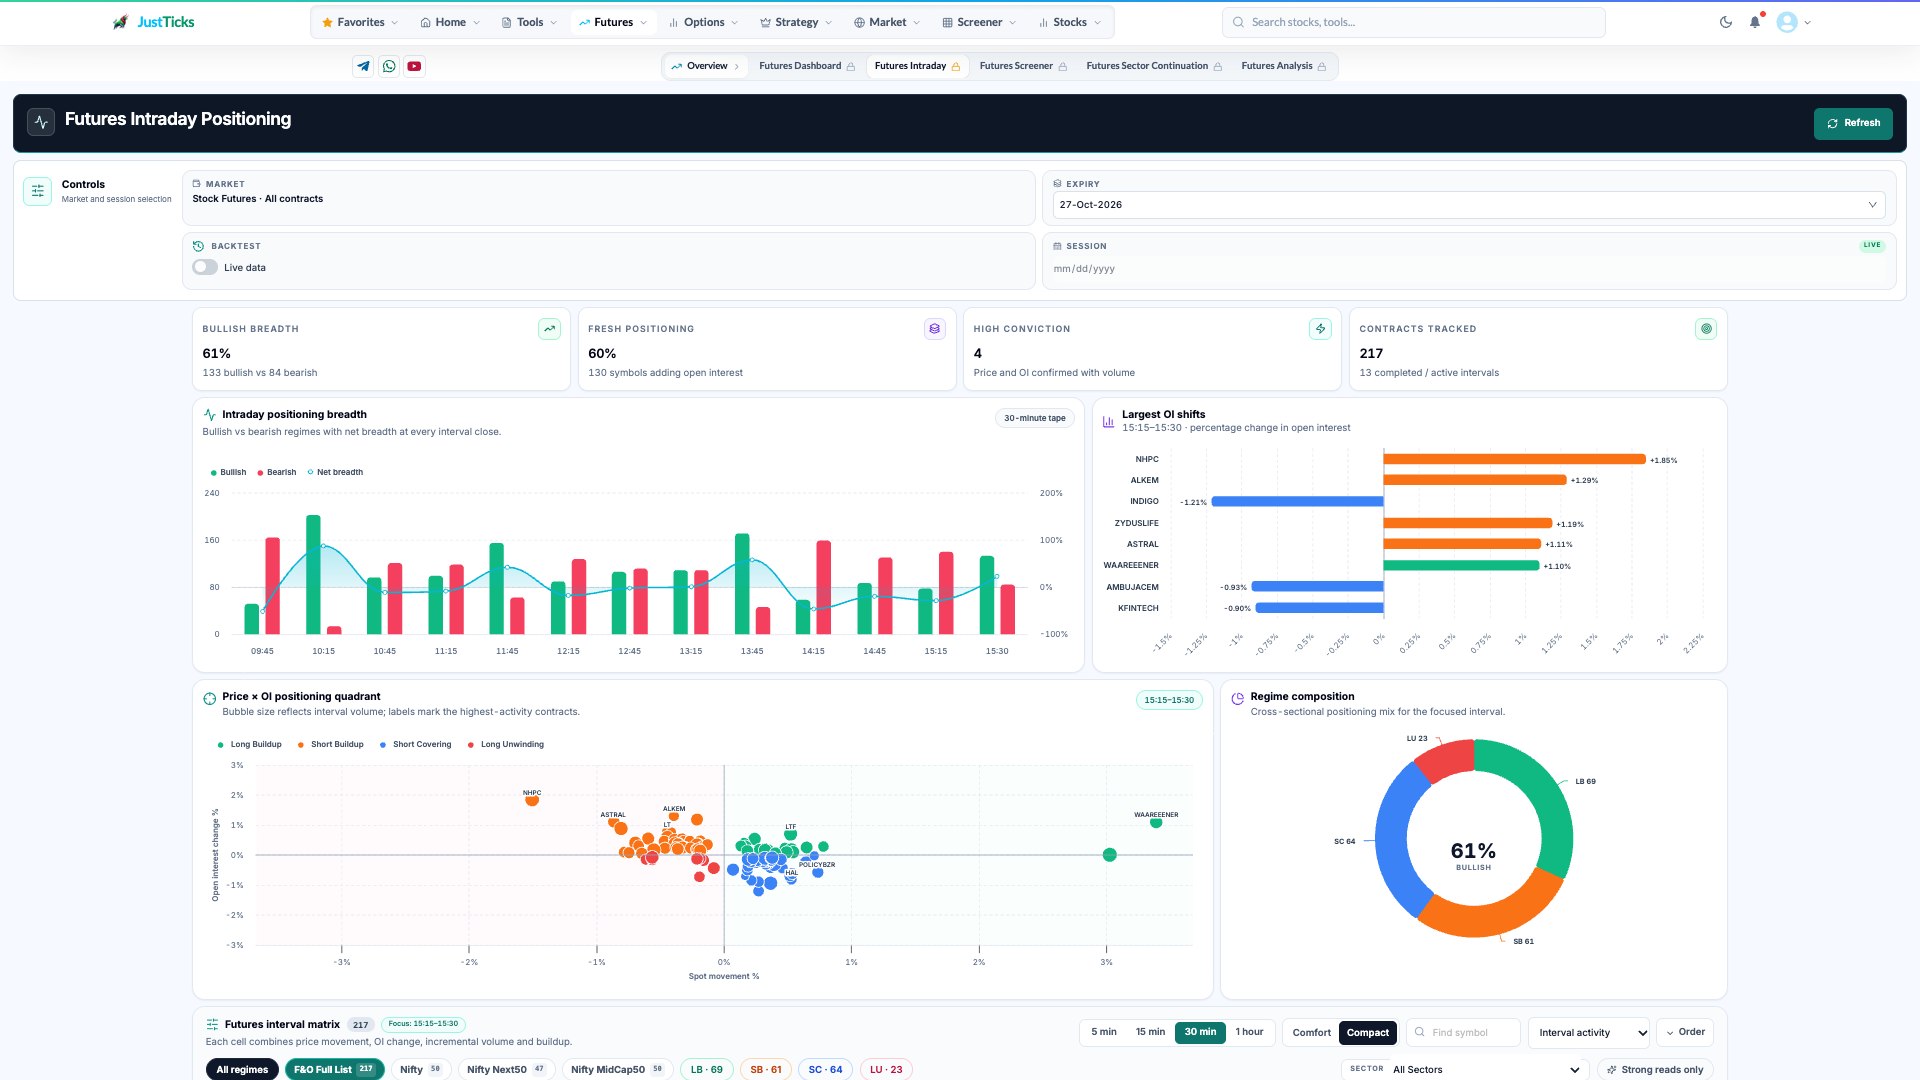
- Expiry. Contract coverage changes when the selected futures expiry changes.
- Positioning breadth. Bullish and bearish counts are classifications of price-and-OI combinations.
- Largest OI shifts. OI percentage changes are distinct from contract volume and price returns.
- Price × OI quadrant. Read both axes; bubble size supplies volume context rather than an extra directional vote.
- Open Futures Intraday Positioning, choose the expiry and session.
- Choose the stock-futures universe and interval length.
- Sort by activity, price, absolute OI change, volume or persistence depending on the question.
- Read several adjacent cells for a symbol and compare the same periods across symbols.
- Use historical mode to review a fixed session; verify the resolved expiry belongs to that historical date.
Session direction can hide interval changes
A stock may show long buildup in the first 30 minutes, short covering in the next and long unwinding later. A positive full-session price change does not erase these different interval observations. Persistence counts repeated model classifications, not a streak of profitable trades.
Keep aggregation consistent
- A 60-minute result combines more activity than a 5-minute cell and can mask reversals inside the interval.
- The newest interval may still be developing.
- Historical expiry resolution matters around expiry and rollover.
- The classification does not reveal which participant initiated every trade.
- Historical review does not include simulated execution, slippage or transaction costs.